 |
|
|
|
|
|
|
| ||||||||||
|
|
|
|
|
|
|
||||
| ||||||||||
|
|
|
|
|
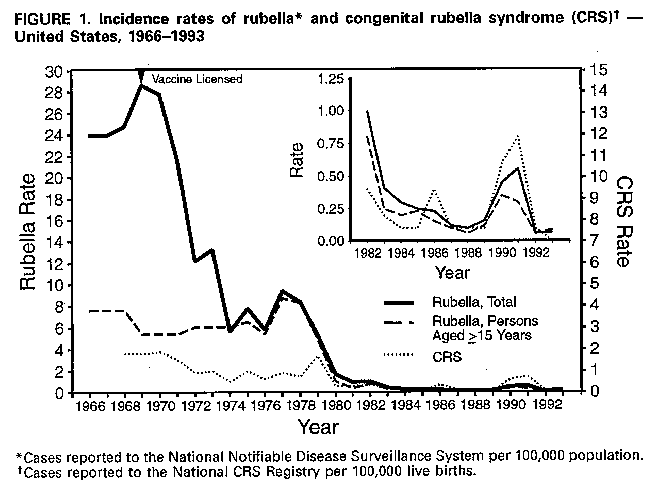
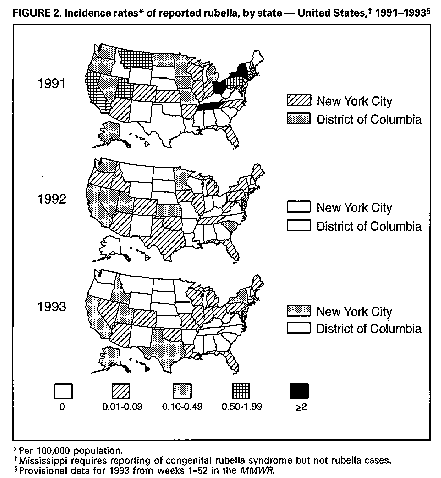
Persons using assistive technology might not be able to fully access information in this file. For assistance, please send e-mail to: [email protected]. Type 508 Accommodation and the title of the report in the subject line of e-mail. Rubella and Congenital Rubella Syndrome -- United States, January 1, 1991-May 7, 1994Following a resurgence of rubella and congenital rubella syndrome (CRS) during 1989-1991, the reported number of rubella cases during 1992 and 1993 was the lowest ever recorded. However, outbreaks of rubella have continued to occur, indicating the need for intensified and sustained efforts to reach the goal of eliminating indigenous rubella and CRS in the United States by 1996. This report summarizes surveillance for rubella and CRS from January 1, 1991, through May 7, 1994. Information is based on cases reported to the National Notifiable Disease Surveillance System (NNDSS) and a telephone survey of 28 areas reporting rubella to obtain verification and information on age, laboratory confirmation, and vaccination status of persons with rubella reported in 1993. Rubella Following an all-time low of 225 cases reported in 1988, the incidence of rubella increased in 1989 and peaked in 1991 with 1401 reported cases (Figure_1) page 397 (1). In 1992, a new low of 160 cases was reported, followed by an increase to 190 reported cases (provisional total) in 1993. In 1991, 33 states, New York City, and the District of Columbia reported rubella cases; six states, each reporting 25 or more cases, together accounted for 91% of all cases reported (Figure_2) page 398. California accounted for 267 (19%) reported cases. Outbreaks among members of religious communities that traditionally refuse vaccination resulted in large increases in cases reported from Michigan, New York, Ohio, Pennsylvania, and Tennessee and accounted for at least 900 (89%) of the 1007 cases reported in these states during 1991. Cases were reported from 27 states and three territories in 1992 and from 24 states and New York City in 1993. As of May 7, 1994, a provisional total of 134 rubella cases has been reported from 11 states and Guam. Age-specific data were available from NNDSS for 1991 and 1992 for all states except California and, in 1993, for all states (Table_1). In 1991, 52% of cases were reported among persons aged 5-19 years and 28% among adults aged greater than or equal to 20 years. The distribution in 1991 reflected outbreaks that occurred in religious communities in which unvaccinated children and young adults congregated in schools and other settings where they were in close contact. In comparison, in 1992 and 1993, 49%-63% of cases occurred among persons aged greater than or equal to 20 years; in addition, the proportion of cases among persons aged greater than or equal to 30 years increased by more than threefold over that in 1991. In each year, 16%-23% of cases occurred among children aged less than 5 years. In 1991, Hispanics and Asians/Pacific Islanders together accounted for 33 (3%) of 1028 cases in persons with known race/ethnicity. In comparison, in 1992, Asians/Pacific Islanders accounted for 27 (39%) of 70 cases with known race, and Hispanics accounted for 14 (19%) of 73 cases with known ethnicity. In 1993, Asians/Pacific Islanders accounted for 31 (29%) of 108 cases with known race, and Hispanics accounted for 39 (22%) of 176 cases with known ethnicity. Outbreaks identified during 1993-1994 primarily have involved persons in prisons, colleges, and work settings. During 1993, outbreaks were identified in six areas: California (an adult class and a prison); New Jersey, New York City, and New York State (work settings); Texas (a college); and Massachusetts (community and a prison). The outbreak that began in Massachusetts in 1993 is ongoing; through May 7, 1994, a total of 99 cases had been reported in prisons, homeless shelters, a psychiatric facility, and a community including persons who immigrated from areas that do not routinely vaccinate against rubella (e.g., most central and south American countries). An outbreak in 1994 in a college in Oklahoma has involved four international students who were unvaccinated. Data on vaccination status of persons with rubella are not routinely collected in NNDSS and were not available for 1991 and 1992. Vaccination status of persons with rubella reported in 1993 was determined by the telephone survey. Of the 190 persons with reported rubella, 13 were not eligible for vaccination (aged less than 1 year). Vaccination status was known for 97 (55%) of the remaining 177 persons; of these, 52 (54%) were unvaccinated, 39 (40%) reported vaccination or specified receipt of one dose, and six (6%) reported receipt of two doses of vaccine. Among persons with reported rubella in 1993, 127 (67%) had clinical diagnosis confirmed by a laboratory, eight (4%) had a clinical diagnosis and were epidemiologically linked to another person with rubella, and 27 (14%) had a clinical diagnosis only; method of ascertainment was unknown for 28 (15%). Congenital Rubella Syndrome Information about CRS was based on data from the National CRS Registry maintained by CDC's National Immunization Program (1,2). The incidence of CRS paralleled the rise and decline of rubella from 1989 to 1993 (Figure_1). During 1991, 31 indigenous cases of confirmed and compatible CRS were reported in the United States (Table_2); 20 (65%) of these occurred in Pennsylvania. A survey to determine the risk for CRS among infants born to Amish mothers residing in one county in Pennsylvania in 1991 indicated the rate of CRS was 14 per 1000 live births, compared with 0.006 for the U.S. total population (3). During 1992, five cases of CRS were reported in the United States, including two in Pennsylvania and three in California. No indigenous CRS was reported among infants born in 1993; three cases reported in 1994 are pending confirmation. Eight imported cases of CRS were reported among infants born during 1991-1993 (with exposure in Mexico {five cases}, Germany {two}, and Poland {one}. Reported by: State and territorial epidemiologists. Div of Surveillance and Epidemiology, Epidemiology Program Office; Epidemiology and Surveillance Div, National Immunization Program, CDC. Editorial NoteEditorial Note: The incidence of rubella among persons aged greater than or equal to 20 years has declined dramatically since licensure of rubella vaccine and since the 1980s, when increased emphasis was placed on vaccinating adolescents and adults, particularly women of childbearing age (4). However, many persons in this age group -- particularly women of childbearing age -- remain susceptible (5). The outbreaks that have occurred since 1991 indicate the ongoing transmission of rubella and underscore the potential risk for CRS. The outbreaks in 1991 occurred primarily among religious groups that remain unvaccinated (3,6). Since 1992, outbreaks have occurred in settings where young adults congregate, particularly among persons in specific racial/ethnic groups (e.g., Asians/Pacific Islanders and Hispanics) who often are unvaccinated. Some of these outbreaks also have been associated with transmission of cases acquired outside the United States. Limited or absent efforts in some countries to vaccinate against rubella also poses a risk for rubella exposure and transmission and of CRS in the United States. For example, in 1993, 27 of 28 reported cases in Hawaii were imported. In the outbreak in Massachusetts that started in 1993, two of the early cases were in persons who had immigrated from Brazil. The outbreak later spread to a community in Boston including immigrants from areas that do not routinely vaccinate against rubella. Since 1989, 14 infants were born in the United States to mothers infected in other countries, including 10 of the 14 whose mothers were from Mexico, where persons are not routinely vaccinated against rubella. The findings in this report indicate that achieving the goal of eliminating indigenous rubella and CRS in the United States by 1996 will require improving control strategies that target young adults (7). Strategies include 1) increasing vaccination coverage in children; 2) implementing laws requiring all students receive two doses of measles-mumps-rubella vaccine; 3) encouraging health-care providers to take advantage of every opportunity to vaccinate susceptible adolescents and adults; 4) adopting prematriculation vaccination requirements in colleges; 5) initiating prevention and control programs in correctional institutions; 6) encouraging persons in religious groups who do not seek health care to accept vaccination; and 7) targeting special vaccination programs toward young adults who are likely to be unvaccinated and to have contact with persons infected with rubella from countries that do not routinely vaccinate against rubella. CDC, in collaboration with state and local health departments, is planning enhanced surveillance to better define the epidemiology of rubella and CRS. Additional information that will be collected for each rubella case includes serologic confirmation, vaccination status, location of exposure (i.e., indigenous or imported), and transmission setting. This information will be used to design more effective prevention strategies for rubella and CRS. References
Figure_1  Return to top. Table_1 Note: To print large tables and graphs users may have to change their printer settings to landscape and use a small font size.
TABLE 1. Age distribution of persons with reported rubella and estimated incidence
rates * -- United States, 1991-1993
====================================================================================
                    1991                 1992                 1993
Age group     ------------------   ------------------   ------------------
  (yrs)       No.    (%)    Rate   No.    (%)    Rate   No.    (%)    Rate
--------------------------------------------------------------------------
   <1          32  (  2.9)   0.8     8  (  7.8)   0.2    13  (  7.0)   0.3
 1- 4         193  ( 17.5)   1.3    16  ( 15.6)   0.1    16  (  8.6)   0.1
 5-19         573  ( 51.9)   1.1    29  ( 28.1)  <0.1    41  ( 21.9)   0.1
20-29         210  ( 19.0)   0.5    20  ( 19.4)  <0.1    58  ( 31.0)   0.1
 >=30          96  (  8.7)  <0.1    30  ( 29.1)  <0.1    59  ( 31.5)  <0.1

Known age    1104  (100.0)    --   103  (100.0)    --   187  (100.0)    --

Unknown age   297    ---      --    57    ---      --     3    ---      --

Total        1401    ---     0.6   160    ---     0.1   190    ---     0.1
--------------------------------------------------------------------------
* Cases per 100,000 population, 1990 U.S. Census.
====================================================================================
Return to top. Figure_2  Return to top. Table_2 Note: To print large tables and graphs users may have to change their printer settings to landscape and use a small font size. Table 2. Number of cases and incidence rates * of congenital rubella syndrome (CRS) + reported to the National CRS Registry -- United States, 1969-1993 & ======================================================================================= Year No. cases Incidence rate | Year No. cases Incidence rate ------------------------------------|-------------------------------------- 1969 62 1.7 | 1982 13 0.4 1970 67 1.8 | 1983 7 0.2 1971 44 1.2 | 1984 2 <0.1 1972 32 1.0 | 1985 2 <0.1 1973 30 1.0 | 1986 13 0.4 1974 22 0.7 | 1987 3 <0.1 1975 32 1.0 | 1988 2 <0.1 1976 22 0.7 | 1989 1 <0.1 1977 29 0.9 | 1990 25 0.6 1978 30 0.9 | 1991 31 0.8 1979 57 1.6 | 1992 5 0.1 1980 14 0.4 | 1993 0 0 1981 10 0.3 | --------------------------------------------------------------------------- * Per 100,000 live births. + Confirmed and compatible cases reported by year of birth. & Excluded are the following imported cases: 1984 (one), 1985 (one), 1986 (two), 1987 (three), 1988 (two), 1990 (six), 1991 (two), 1992 (five), and 1993 (one). ======================================================================================= Return to top. Disclaimer All MMWR HTML versions of articles are electronic conversions from ASCII text into HTML. This conversion may have resulted in character translation or format errors in the HTML version. Users should not rely on this HTML document, but are referred to the electronic PDF version and/or the original MMWR paper copy for the official text, figures, and tables. An original paper copy of this issue can be obtained from the Superintendent of Documents, U.S. Government Printing Office (GPO), Washington, DC 20402-9371; telephone: (202) 512-1800. Contact GPO for current prices. **Questions or messages regarding errors in formatting should be addressed to [email protected].Page converted: 09/19/98 |
|||||||||
This page last reviewed 5/2/01
|