 |
|
|
|
|
|
|
| ||||||||||
|
|
|
|
|
|
|
||||
| ||||||||||
|
|
|
|
|
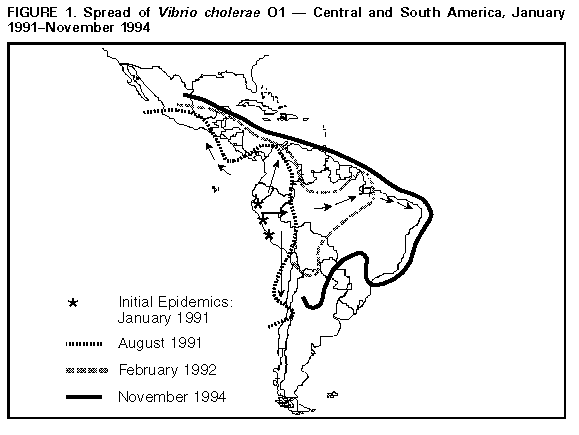
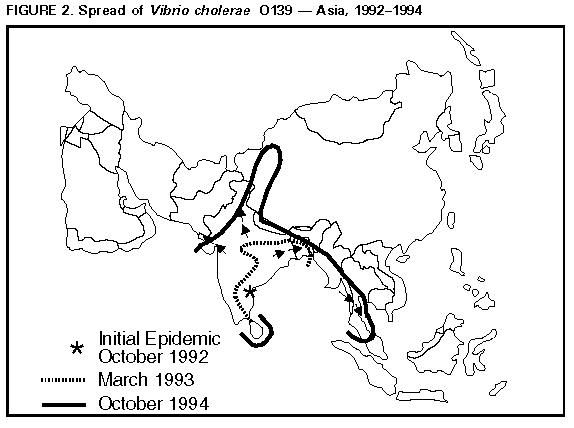
Persons using assistive technology might not be able to fully access information in this file. For assistance, please send e-mail to: [email protected]. Type 508 Accommodation and the title of the report in the subject line of e-mail. Update: Vibrio cholerae O1 -- Western Hemisphere, 1991-1994, and V. cholerae O139 -- Asia, 1994The cholera epidemic caused by Vibrio cholerae O1 that began in January 1991 has continued to spread in Central and South America Figure_1. In southern Asia, the epidemic caused by the newly recognized strain V. cholerae O139 that began in late 1992 also has continued to spread Figure_2. This report updates surveillance findings for both epidemics. From the onset of the V. cholerae O1 epidemic in January 1991 through September 1, 1994, a total of 1,041,422 cases and 9642 deaths (overall case-fatality rate: 0.9%) were reported from countries in the Western Hemisphere to the Pan American Health Organization. In 1993, the numbers of reported cases and deaths were 204,543 and 2362, respectively Table_1. From January 1 through September 1, 1994, a total of 92,845 cases and 882 deaths were reported. In 1993 and 1994, the number of reported cases decreased in some countries but continued to increase in several areas of Central America, Brazil, and Argentina (1-3). The epidemic of cholera caused by V. cholerae O139 has affected at least 11 countries in southern Asia. V. cholerae O139 produces severe watery diarrhea and dehydration that is indistinguishable from the illness caused by V. cholerae O1 (4) and appears to be closely related to V. cholerae O1 biotype El Tor strains (5). Specific totals for numbers of V. cholerae O139 cases are unknown because affected countries do not report infections caused by O1 and O139 separately; however, greater than 100,000 cases of cholera caused by V. cholerae O139 may have occurred (6). In the United States during 1993 and 1994, 22 and 47 cholera cases were reported to CDC, respectively. Of these, 65 (94%) were associated with foreign travel. Three of these were culture-confirmed cases of V. cholerae O139 infection in travelers to Asia. Reported by: Cholera Task Force, Diarrheal Disease Control Program, World Health Organization, Geneva. Expanded Program for the Control of Diarrheal Diseases, Special Program on Maternal and Child Health and Population, Pan American Health Organization, Washington, DC. Foodborne and Diarrheal Diseases Br, Div of Bacterial and Mycotic Diseases, National Center for Infectious Diseases, CDC. Editorial NoteEditorial Note: Cholera is transmitted through ingestion of fecally contaminated food and beverages. Because cholera remains epidemic in many parts of Central and South America, Asia, and Africa, health-care providers should be aware of the risk for cholera in persons traveling in cholera-affected countries -- particularly those persons who are visiting relatives or departing from the usual tourist routes because they may be more likely to consume unsafe foods and beverages. Persons traveling in cholera-affected areas should not eat food that has not been cooked and is not hot (particularly fish and shellfish) and should drink only beverages that are carbonated or made from boiled or chlorinated water. The licensed parenteral cholera vaccine provides only limited and brief protection against V. cholerae O1, may not provide any protection against V. cholerae O139, and has a high cost-benefit ratio (7); therefore, the vaccine is not recommended for travelers (8). New oral cholera vaccines are being developed and provide more reliable protection, although still at a high cost per case averted. None of these vaccines have attained the combination of high efficacy, long duration of protection, simplicity of administration, and low cost necessary to make mass vaccination feasible in cholera-affected countries. The diagnosis of cholera should be considered in patients with watery diarrhea who have recently (i.e., within 7 days) returned from cholera-affected countries (9). Patients with suspected cholera should be reported immediately to local and state health departments. Treatment of cholera includes rapid fluid and electrolyte replacement with adjunctive antibiotic therapy. Stool specimens should be cultured on thiosulfate-citrate-bile salts-sucrose (TCBS) agar. Clinical isolates of non-O1 V. cholerae should be referred to a state public health laboratory for testing for O139 if the patient traveled in an O139-affected area, has life-threatening dehydration typical of severe cholera, or has been linked to an outbreak of diarrhea. References
Figure_1  Return to top. Figure_2  Return to top. Table_1 Note: To print large tables and graphs users may have to change their printer settings to landscape and use a small font size.
TABLE 1. Number of cholera cases and deaths reported to the Pan American Health Organization and case-fatality rate, by
region -- Western Hemisphere, January 1, 1991-September 1, 1994
=========================================================================================================================
                                            No. cases                                              Case fatality
                    --------------------------------------------------------      Total deaths         rate +
Region/Country         1991       1992       1993       1994 *        Total        1991-1994         1991-1994
----------------------------------------------------------------------------------------------------------------
South America
  Argentina               0        533      2,080        887          3,520              64            1.8%
  Bolivia               206     22,260     10,134      2,603         35,203             695            2.0%
  Brazil              2,101     30,054     52,286     45,984        134,425           1,359            1.0%
  Chile                  41         73         32          0            146               3            2.0%
  Colombia           11,979     15,129        230        143         27,481             370            1.3%
  Ecuador            46,320     31,870      6,833      1,406         86,429             992            1.1%
  French Guyana           1         16          2         NR+            19               0
  Guyana                  0        556         66          0            622              10            1.6%
  Paraguay                0          0          3          0              3               0
  Peru              322,562    210,836     71,448     20,413        625,259           4,396            0.7%
  Suriname                0         12          0          0             12               1            8.3%
  Venezuela              13      2,842        409          0          3,264              80            2.4%

Central America
  Belize                  0        159        135          2            296               8            2.7%
  Costa Rica              0         12         14          5             31               0
  El Salvador           947      8,106      6,573     11,191         26,817             125            0.5%
  Guatemala           3,652     15,686     30,605      3,047         52,990             655            1.2%
  Honduras               17        388      2,290        842          3,537             112            3.1%
  Mexico              2,690      8,162     10,712      2,383         23,947             351            1.5%
  Nicaragua               1      3,067      6,631      3,928         13,627             338            2.5%
  Panama              1,178      2,416         42          0          3,636              82            2.2%

North America
  United States          26        103         18&        11            158               1            0.6%

Total               391,734    352,300    204,543     92,845      1,041,422           9,642            0.9%
----------------------------------------------------------------------------------------------------------------
* Cases reported through September 1, 1994.
+ Not reported.
& Four additional cases that occurred in 1993 were reported after September 1, 1994.
=========================================================================================================================
Return to top. Disclaimer All MMWR HTML versions of articles are electronic conversions from ASCII text into HTML. This conversion may have resulted in character translation or format errors in the HTML version. Users should not rely on this HTML document, but are referred to the electronic PDF version and/or the original MMWR paper copy for the official text, figures, and tables. An original paper copy of this issue can be obtained from the Superintendent of Documents, U.S. Government Printing Office (GPO), Washington, DC 20402-9371; telephone: (202) 512-1800. Contact GPO for current prices. **Questions or messages regarding errors in formatting should be addressed to [email protected].Page converted: 09/19/98 |
|||||||||
This page last reviewed 5/2/01
|