 |
|
|
|
|
|
|
| ||||||||||
|
|
|
|
|
|
|
||||
| ||||||||||
|
|
|
|
|
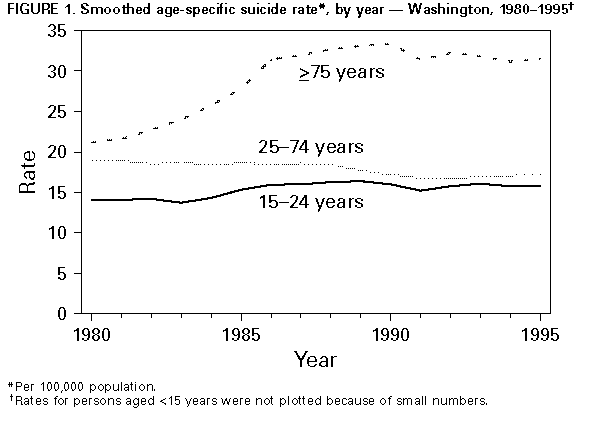
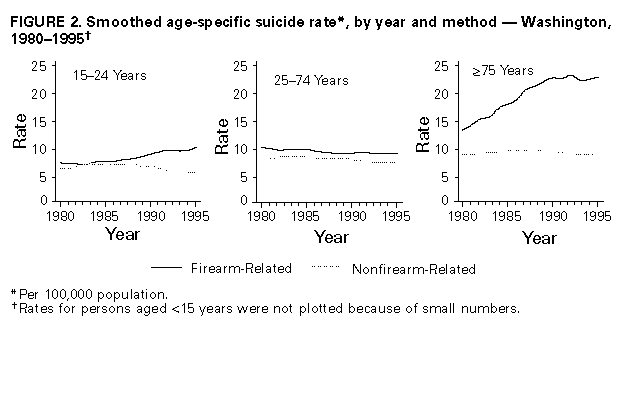
Persons using assistive technology might not be able to fully access information in this file. For assistance, please send e-mail to: [email protected]. Type 508 Accommodation and the title of the report in the subject line of e-mail. Suicide -- Washington, 1980-1995The ongoing assessment of health data and health data sources is essential to the development of effective prevention strategies for priority health issues. In Washington, assessment efforts include the analysis of suicide data. In 1995, suicide was the eighth leading cause of death in Washington (1), and most (58%) were firearm related. To determine trends in suicide during 1980-1995, the Injury Prevention Program of the Washington Department of Health (WDOH) analyzed death-certificate data. This report presents the findings of the analysis, which indicate that, while overall suicide rates in Washington remained relatively stable during 1980-1995, suicides became more common among persons aged 15-24 years and greater than or equal to 75 years and less common among persons aged 25-74 years. Computerized death-certificate data and external cause-of-injury codes (E-codes) were used to identify all suicides (E950-E959) among Washington residents. Population data were derived from the 1980 and 1990 U.S. census and from intercensal and postcensal estimates from the Office of Management of Washington state. Contiguous age categories with similar death rates were grouped, and patterns within age groups were examined. The average 1-year change in mortality was estimated using negative binomial regression in models that accounted for changes in the age, sex distribution, and size of the population. This regression method is useful for analyzing count data that do not meet the restrictive assumptions of Poisson models (2). Results are expressed as the overall percentage change in mortality from 1980 to 1995. Trends are presented graphically using robust locally weighted regression (3). Because suicide methods might change over time, trends in firearm-related suicides were compared with those in nonfirearm-related suicides. During 1980-1995, a total of 10,650 suicides occurred in Washington, representing an overall average rate of 14.2 per 100,000 population. The most common method of suicide was use of firearms (E950.0-E955.4) (56%), followed by poisoning (E950-E954) (23%), suffocation (E953) (13%), and other or unspecified means (8%). Most (78%) suicides occurred among males. Although the overall average rate of suicide in the total population remained relatively constant during the 16-year period, the rate of firearm-related suicide increased 8% (p=0.2), and the rate of suicide by other means decreased 15% (p less than 0.01) (Table_1). Changes in the overall suicide rate varied by age, increasing by 127% for children aged 5-14 years (all except one suicide in this age group during 1980-1995 occurred among children aged 10-14 years); by 16% for persons aged 15-24 years; and by 42% for persons aged greater than or equal to 75 years (Figure_1). For persons aged 25-74 years, the rate declined substantially. The increase for children aged 5-14 years primarily reflected an increase in nonfirearm-related suicide, the increase for persons aged 15-24 years and greater than or equal to 75 years reflected an increase in firearm-related suicide, and the decrease for persons aged 25-74 years reflected a decrease in both firearm-related and nonfirearm-related suicide (Figure_2). Reported by: M LeMier, MPH, D Keck, Injury Prevention Program, Washington Dept of Health; P Cummings, MD, Harborview Injury Prevention and Research Center, Seattle. Div of Violence Prevention, National Center for Injury Prevention and Control, CDC. Editorial NoteEditorial Note: The analysis by WDOH illustrates the usefulness of death-certificate data in assessing trends in suicide. Although overall suicide rates remained stable among residents of Washington during 1980-1995, age-specific analyses indicate that the rate of nonfirearm-related suicide increased significantly for children aged 5-14 years, and the rate of firearm-related suicide increased for persons aged 15-24 years and the elderly (aged greater than or equal to 75 years). Suicide rates for persons aged 25-74 years declined, reflecting a decrease in both firearm-related and nonfirearm-related suicide. These findings can assist in identifying risk factors for suicide and high-risk groups; such analyses should be considered by other state and local health departments to better understand local suicide trends and guide prevention efforts. The high proportion of firearm-related suicides in Washington is consistent with national patterns during the 1980s and 1990s (4). The increases in Washington in the overall rates of suicide for youths and for the elderly and in the rate of firearm-related suicide for persons aged greater than or equal to 75 years also were consistent with national trends. Although reasons for these increasing trends in suicide are unknown, potential explanations include changes in the prevalence of depression, the use of more lethal methods, and changes in societal attitudes toward suicide among the elderly. The findings in this analysis may have underestimated the true rate of suicide. The intent of some persons who commit suicide may be unknown or unrecognized; therefore, their deaths may not be reported as suicides. The magnitude of underreporting associated with these misclassification errors is unknown. In contrast, a previous report indicated that coding a nonsuicide death as a suicide probably is uncommon; in that study, 90% of deaths coded as suicides were coded correctly (5). Routine collection of the circumstances of injury events may assist in more accurate coding of suicides on death certificates and in developing effective prevention strategies. In Washington, efforts to improve basic injury data collection include the reporting of firearm injury data to WDOH by all hospitals (admissions and emergency department visits), coroners, and medical examiners. In addition, WDOH is collecting information about the intent and circumstances of shootings and the types of firearms involved. An important prevention measure for persons who are suicidal is to restrict access to highly lethal methods of suicide (6). For example, measures associated with reductions in suicide rates without compensatory increases in the use of other methods include removal of carbon monoxide from domestic gas (7), limiting the size of prescriptions to barbituates and other drugs commonly used in self-poisonings (8), and restricting access to handguns (9). In addition to means restrictions, other interventions for reducing the risk for suicide include 1) training of clergy, tribal leaders, school personnel, health-care professionals, and others who have contact with persons who may be contemplating suicide to recognize persons at risk for suicide and refer them for appropriate counseling; 2) educating the general public about warning signs for suicide and opportunities to seek help; 3) implementing screening programs for identifying and referring persons at highest risk for suicide; 4) improving access to or promoting crisis centers, hotlines, and peer support groups (including family and friends) for high-risk persons; and 5) implementing post-suicide actions to reduce the probability of cluster suicides (5). The effectiveness of each of these suicide-prevention strategies requires further assessment. WDOH, in collaboration with the University of Washington School of Nursing, has developed a Youth Suicide Prevention Plan (10) that includes a public education campaign to heighten awareness among adults about the increasing problem of youth suicide and to teach adults how to recognize common suicide warning signs and how to respond to youth who exhibit these signs. In addition, the program provides adults working with high-risk youth with information about effective screening and crisis-intervention strategies. The goals of this plan are to 1) prevent both fatal and nonfatal suicide behaviors among youth; 2) reduce the impact of suicide and suicidal behaviors on individuals, families, and communities; and 3) improve access to and availability of appropriate prevention services for at-risk persons and groups. Although this program is designed to prevent suicide among youths, some elements of the program may be useful to prevent suicide among the elderly. References
+------------------------------------------------------------------ ----+ | Erratum: Vol. 46, No. 22 | | | | In the article "Suicide -- Washington, 1980-1995," an error | | appears on page 503 in Table 1. The p value for the "Total" line | | for persons aged 15-24 years is 0.02 but should have been 0.2. | +------------------------------------------------------------------ ----+ Table_1 Note: To print large tables and graphs users may have to change their printer settings to landscape and use a small font size.
TABLE 1. Number and average rate* of suicides, 1980-1995, and overall percentage change in rate from 1980
to 1995, by age group and method of death -- Washington
===============================================================================================================
                                                  Suicides            Overall change in rate from 1980 to 1995
                                           -----------------------    -----------------------------------------
Age group (yrs)/ Method of death               No.    Average rate      (%)          (95% CI +)  p value &
---------------------------------------------------------------------------------------------------------------
 5-14
  Firearm                                       56             0.5      69%     (-30% to 310%)        0.2
  Nonfirearm                                    47             0.4     215%     ( 17% to 753%)        0.02
  Total                                        103             0.9     127%     ( 15% to 349%)        0.02
15-24
  Firearm                                      973             8.6      46%     ( 14% to  87%)       <0.01
  Nonfirearm                                   762             6.7    - 14%     (-34% to  13%)        0.3
  Total                                      1,735            15.4      16%     (- 6% to  43%)        0.02
25-74
  Firearm                                    4,200             9.7    - 11%     (-22% to   2%)        0.09
  Nonfirearm                                 3,580             8.2    - 19%     (-29% to - 6%)       <0.01
  Total                                      7,780            17.9    - 17%     (-26% to - 7%)       <0.01
>=75
  Firearm                                      705            20.2      70%     ( 27% to 128%)       <0.001
  Nonfirearm                                   327             9.4    -  5%     (-35% to  39%)        0.8
  Total                                      1,032            29.5      42%     ( 10% to  83%)       <0.01
All ages
  Firearm                                    5,934             7.9       8%     (- 4% to  21%)        0.2
  Nonfirearm                                 4,716             6.3    - 15%     (-24% to - 4%)       <0.01
  Total                                     10,650            14.2    -  3%     (-12% to   7%)        0.6
---------------------------------------------------------------------------------------------------------------
* Per 100,000 person-years.
+ Confidence interval.
& A test for linear trend in rates during 1980-1995.
===============================================================================================================
Return to top. Figure_1  Return to top. Figure_2  Return to top. Disclaimer All MMWR HTML versions of articles are electronic conversions from ASCII text into HTML. This conversion may have resulted in character translation or format errors in the HTML version. Users should not rely on this HTML document, but are referred to the electronic PDF version and/or the original MMWR paper copy for the official text, figures, and tables. An original paper copy of this issue can be obtained from the Superintendent of Documents, U.S. Government Printing Office (GPO), Washington, DC 20402-9371; telephone: (202) 512-1800. Contact GPO for current prices. **Questions or messages regarding errors in formatting should be addressed to [email protected].Page converted: 09/19/98 |
|||||||||
This page last reviewed 5/2/01
|