 |
|
|
|
|
|
|
| ||||||||||
|
|
|
|
|
|
|
||||
| ||||||||||
|
|
|
|
|
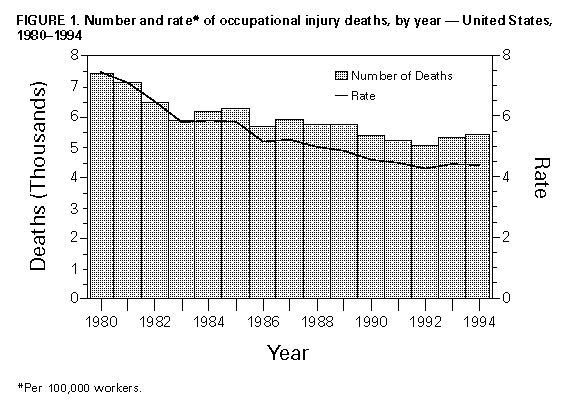
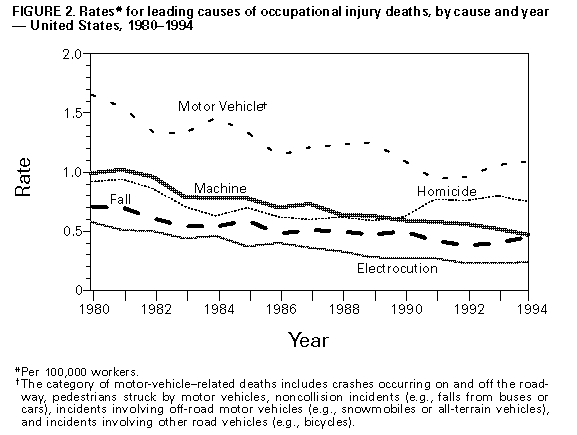
Persons using assistive technology might not be able to fully access information in this file. For assistance, please send e-mail to: [email protected]. Type 508 Accommodation and the title of the report in the subject line of e-mail. Fatal Occupational Injuries -- United States, 1980-1994CDC's National Institute for Occupational Safety and Health (NIOSH) monitors occupational injury deaths through death certificates compiled for the National Traumatic Occupational Fatalities (NTOF) surveillance system * (1). Previous reports analyzed data from 1980-1989 (1-3). This report updates these estimates on the magnitude of work-related injury deaths for the United States from 1980 through 1994, the most recent year for which data are available from this system, and identifies high-risk industries and occupations at national and state-specific levels. The findings indicate that the annual total number of deaths and crude death rates decreased from 7405 (7.5 per 100,000 workers) in 1980 to 5406 (4.4 per 100,000 workers) in 1994. National death rates were calculated using denominators from employment data from the Current Population Survey, a population-based household survey of the Bureau of Labor Statistics (BLS) (4). Deaths among military workers were excluded from the analyses because the employment data do not include military employment numbers. Crude death rates per 100,000 workers were calculated as the number of deaths among civilian workers for each year divided by the number of employed civilians for each year. Because published estimates for employment by state exclude self-employed workers and report government workers separately, computerized data files obtained from the 1990-1994 BLS Current Population Survey monthly employment files (5), which include self-employed and government workers by industry categories, were used to calculate death rates by state. National Estimates, 1980-1994 From 1980 through 1994, a total of 88,622 civilian workers died in the United States from occupational injuries, an average of 16 work-related deaths per day. The annual total number of deaths declined 27%, from 7405 in 1980 to 5406 in 1994 (Figure_1). The average rate for occupational injury deaths for all workers decreased 41%, from 7.5 per 100,000 workers in 1980 to 4.4 per 100,000 workers in 1994 (Figure_1). Motor-vehicle-related deaths, ** the leading cause of death for U.S. workers since 1980 (Figure_2), accounted for 23.1% of deaths during the 15-year period. Homicides became the second leading cause of occupational injury deaths in 1990 (13.5% of occupation-related deaths), surpassing machine-related deaths (13.3% of total). The industries in which the largest numbers of deaths occurred during this period were construction (16,091 deaths {18.2%}), transportation/communication/public utilities (15,668 {17.7%}), and manufacturing (12,371 {14.0%}). Industries with the highest death rates per 100,000 workers were mining (30.5), agriculture/ forestry/fishing (20.5), and construction (15.5). The occupation categories in which the largest numbers of deaths occurred were precision production/crafts/repairers (17,392 {19.6%}), transportation/material movers (16,134 {18.2%}), and farmers/foresters/ fishers (10,960 {12.4%}). Occupation categories with the highest death rates per 100,000 workers were transportation/material movers (23.0), farmers/foresters/fishers (20.7), and handlers/equipment cleaners/helpers/laborers (15.1). State Estimates, 1990-1994 From 1990 through 1994, motor-vehicle-related incidents were the leading cause of occupational death in 38 states (Table_1). Machine-related incidents were the leading cause of death in five states; homicides, in three states and the District of Columbia; falls, in two states; and water transport and struck by falling objects, one state each. The construction industry accounted for the largest number of work-related deaths in 19 states; manufacturing, in 12 states; agriculture/forestry/fishing, in 11 states; transportation/communication/public utilities, in five states; retail trade, in one state and the District of Columbia; services, in one state; and mining, in one state. Mining was the highest risk industry in 26 states; agriculture/forestry/fishing, in 19 states; construction, in three states and the District of Columbia; and transportation/communication/public utilities, in two states. The largest numbers of deaths, by occupation, were among precision production/crafts/repairers in 29 states; farmers/foresters/fishers in 14 states; transportation/material movers in eight states; and service workers in the District of Columbia. Occupation categories with the highest rates were farmers/foresters/fishers in 28 states; transportation/material movers in 20 states; handlers/equipment cleaners/helpers/laborers in one state and the District of Columbia; and technicians and related technical support occupations in one state. Reported by: Div of Safety Research, National Institute for Occupational Safety and Health, CDC. Editorial NoteEditorial Note: The findings in this report indicate a general decrease in occupational injury deaths in the United States during 1980-1994. The decreases include the total numbers and average crude rates of deaths over the years and the average number of work-related deaths per year from the 1980s (6359) through 1994 (5267). In addition, the leading causes of death have changed through the 1990s. Although surveillance data cannot identify the reasons for these changes over time, there have been many changes in the workplace that may have contributed to these changes (e.g., increased regulations and hazard awareness and new technology and mechanization) as well as changes in the economy, the industrial mix, and the distribution of the workforce (3). The findings of this analysis are subject to at least two limitations. First, only 67%-90% of all fatal occupational injuries can be identified through death certificates (1). Second, classification of "on-the-job" differs among medical examiners and coroners (6). Because of these limitations, the numbers presented in this report should be considered as minimum values. The NTOF surveillance system, the most comprehensive source of surveillance data for fatal work-related injuries during 1980-1991, allows examination of trends over time and analysis of data within states, useful tools for identifying injury patterns and suggesting targets for preventive interventions. To address the limitations of death certificates and other existing data sources in the surveillance of fatal occupational injuries, in 1992 the BLS began collecting national work-related death data through the Census of Fatal Occupational Injuries (CFOI). CFOI is a multi-source surveillance system that typically requires at least two source documents *** to verify work-relatedness (7-10). Although CFOI and NTOF identified similar patterns for industry and occupation in 1994, NTOF captured 5406 civilian deaths and CFOI captured 6528 (10). Another difference between the two surveillance systems is that the coding systems used to specify cause of death differ: NTOF uses E-codes from the International Classification of Diseases, Ninth Revision (1); CFOI uses the BLS-designed Occupational Injury and Illness Classification System (7-10). Direct comparisons of the two systems are complicated, but broad results on cause of death appear to be similar. The data presented in this report provide the basis for strategies to prevent traumatic work-related injury deaths by taking into account high-risk industries and occupations and the varying patterns of fatal injuries identified in these data. In particular, state health departments and others involved in prevention of occupational injuries can use the state-specific data to identify high-priority areas for intervention. Additional state-specific data and information about NTOF are available from NIOSH; telephone (800) 356-4674 or (513) 533-8328. References
* NTOF is based on death certificates compiled from 52 vital statistics reporting units in the United States. Inclusion criteria for death certificate submission to the NTOF database include 1) age greater than or equal to 16 years; 2) external cause of death (International Classification of Diseases, Ninth Revision, codes E800-E999); and 3) "injury at work" designation. ** The category of motor-vehicle-related deaths includes crashes occurring on and off the roadway, pedestrians struck by motor vehicles, noncollision incidents (e.g., falls from buses or cars), incidents involving off-road motor vehicles (e.g., snowmobiles or all-terrain vehicles), and incidents involving other road vehicles (e.g., bicycles). *** CFOI source documents include death certificates, Workers' Compensation records, and reports to federal and state agencies. Figure_1  Return to top. Figure_2  Return to top. Table_1 Note: To print large tables and graphs users may have to change their printer settings to landscape and use a small font size.
TABLE 1. Leading causes of occupational injury deaths and major industry and occupation categories with highest
numbers and rates of death, by state -- United States, 1990-1994
=================================================================================================================
                                           Industry                       Occupation
State                  Loading cause       Highest no.     Highest rate   Highest no.       Highest rate
-----------------------------------------------------------------------------------------------------------------
Alabama                Motor vehicle*      Manufacturing   Mining         Crafts+           Transport&
Alaska                 Water transport     Ag/For/Fish@    Ag/For/Fish    Farm/For/Fish**   Farm/For/Fish
Arizona                Struck by falling   Construction    Mining         Crafts            Transport
Arkansas               Motor vehicle       Manufacturing   Ag/For/Fish    Transport         Transport
California             Homicide            Service         Mining         Crafts            Transport
Colorado               Motor vehicle       TCPU++          Ag/For/Fish    Crafts            Farm/For/Fish
Connecticut            Motor vehicle       Manufacturing   Ag/For/Fish    Crafts            Transport
Delaware               Motor vehicle       Manufacturing   Ag/For/Fish    Crafts            Farm/For/Fish
District of Columbia   Homicide            Retail trade    Construction   Services          Laborers
Florida                Motor vehicle       Construction    Ag/For/Fish    Crafts            Transport
Georgia                Motor vehicle       Construction    Ag/For/Fish    Crafts            Transport
Hawaii                 Motor vehicle       Construction    Ag/For/Fish    Crafts            Transport
Idaho                  Motor vehicle       Ag/For/Fish     Ag/For/Fish    Farm/For/Fish     Transport
Illinois               Motor vehicle       Construction    Ag/For/Fish    Crafts            Farm/For/Fish
Indiana                Motor vehicle       TCPU            Ag/For/Fish    Transport         Farm/For/Fish
Iowa                   Machine             Ag/For/Fish     Ag/For/Fish    Farm/For/Fish     Farm/For/Fish
Kansas                 Motor vehicle       Ag/For/Fish     Mining         Farm/For/Fish     Transport
Kentucky               Motor vehicle       Ag/For/Fish     Mining         Crafts            Farm/For/Fish
Louisiana              Motor vehicle       TCPU            Mining         Crafts            Transport
Maine                  Motor vehicle       Manufacturing   Ag/For/Fish    Farm/For/Fish     Farm/For/Fish
Maryland               Motor vehicle       TCPU            Mining         Crafts            Farm/For/Fish
Massachusetts          Falls               Construction    Ag/For/Fish    Crafts            Farm/For/Fish
Michigan               Homicide            Manufacturing   Ag/For/Fish    Crafts            Farm/For/Fish
Minnesota              Motor vehicle       Ag/For/Fish     Mining         Farm/For/Fish     Farm/For/Fish
Mississippi            Motor vehicle       Manufacturing   TCPU           Transport         Farm/For/Fish
Missouri               Motor vehicle       Ag/For/Fish     Mining         Transport         Farm/For/Fish
Montana                Machine             TCPU            Mining         Farm/For/Fish     Transport
Nebraska               Motor vehicle       Ag/For/Fish     Mining         Farm/For/Fish     Farm/For/Fish
Nevada                 Motor vehicle       Construction    Mining         Crafts            Transport
New Hampshire          Motor vehicle       Construction    Construction   Crafts            Farm/For/Fish
New Jersey             Motor vehicle       Construction    Ag/For/Fish    Crafts            Farm/For/Fish
New Mexico             Motor vehicle       Construction    Mining         Transport         Transport
New York               Homicide            Retail trade    Mining         Transport         Laborers
North Carolina         Motor vehicle       Manufacturing   Ag/For/Fish    Crafts            Farm/For/Fish
North Dakota           Machine             Ag/For/Fish     Mining         Farm/For/Fish     Transport
Ohio                   Motor vehicle       Manufacturing   Mining         Crafts            Farm/For/Fish
Oklahoma               Motor vehicle       Construction    Mining         Crafts            Transport
Oregon                 Motor vehicle       Manufacturing   Mining         Farm/For/Fish     Farm/For/Fish
Pennsylvania           Motor vehicle       Construction    Mining         Transport         Transport
Rhode Island           Falls               Construction    Ag/For/Fish    Crafts            Farm/For/Fish
South Carolina         Motor vehicle       Construction    Construction   Crafts            Farm/For/Fish
South Dakota           Motor vehicle       Ag/For/Fish     Ag/For/Fish    Farm/For/Fish     Farm/For/Fish
Tennessee              Machine             Construction    Mining         Crafts            Farm/For/Fish
Texas                  Motor vehicle       Construction    Mining         Crafts            Transport
Utah                   Motor vehicle       Construction    Mining         Crafts            Transport
Vermont                Motor vehicle       Manufacturing   TCPU           Transport         Transport
Virginia               Motor vehicle       Construction    Mining         Crafts            Farm/For/Fish
Washington             Motor vehicle       Manufacturing   Mining         Farm/For/Fish     Farm/For/Fish
West Virginia          Motor vehicle       Mining          Mining         Crafts            Farm/For/Fish
Wisconsin              Machine             Ag/For/Fish     Mining         Farm/For/Fish     Farm/For/Fish
Wyoming                Motor vehicle       Construction    Construction   Crafts            Tech/Support&&
-----------------------------------------------------------------------------------------------------------------
*  The category of motor-vehicle-related deaths includes crashes occurring on and off the roadway,
   pedestrians struck by motor vehicles, noncollision incidents (e.g., falls from buses or cars), incidents
   involving off-road motor vehicles (e.g., snowmobiles or all-terrain vehicles), and incidents involving other
   road vehicles (e.g., bicycles).
+  Precision production/Crafts/Repairers.
&  Transportation/Material movers.
@  Agriculture/Forestry/Fishing.
** Farmers/Foresters/Fishers.
++ Transportation/Communication/Public utilities.
@@ Technicians and related technical support occupations.
=================================================================================================================
Return to top. Disclaimer All MMWR HTML versions of articles are electronic conversions from ASCII text into HTML. This conversion may have resulted in character translation or format errors in the HTML version. Users should not rely on this HTML document, but are referred to the electronic PDF version and/or the original MMWR paper copy for the official text, figures, and tables. An original paper copy of this issue can be obtained from the Superintendent of Documents, U.S. Government Printing Office (GPO), Washington, DC 20402-9371; telephone: (202) 512-1800. Contact GPO for current prices. **Questions or messages regarding errors in formatting should be addressed to [email protected].Page converted: 10/05/98 |
|||||||||
This page last reviewed 5/2/01
|