 |
|
|
|
|
|
|
| ||||||||||
|
|
|
|
|
|
|
||||
| ||||||||||
|
|
|
|
|
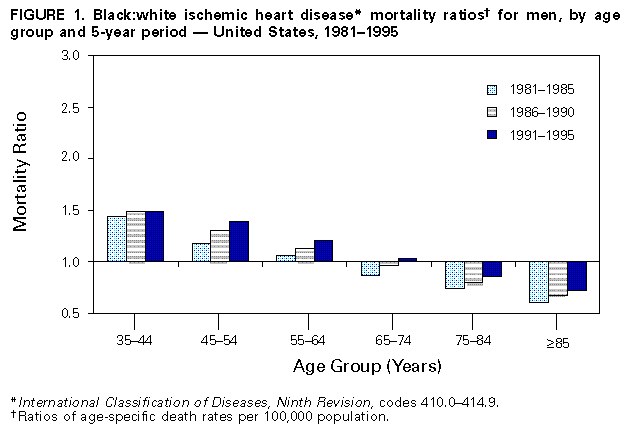
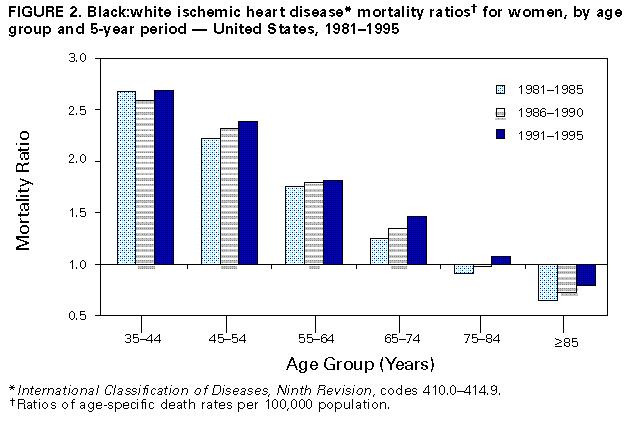
Persons using assistive technology might not be able to fully access information in this file. For assistance, please send e-mail to: [email protected]. Type 508 Accommodation and the title of the report in the subject line of e-mail. Trends in Ischemic Heart Disease Death Rates for Blacks and Whites -- United States, 1981-1995During 1995, ischemic heart disease (IHD) caused 21% of all deaths and 65% of deaths attributed to heart disease (1). Few reports comparing IHD mortality between blacks and whites have presented age-specific rates (2,3), and none have compared trends over time. This report examines the trend in age-specific IHD death rates for blacks and whites from 1981 through 1995 (the latest year for which data are available) and indicates that, in the younger age groups (35-64 years), blacks have a higher risk for IHD death than whites. Average annual age-adjusted and age-specific IHD death rates for persons aged greater than or equal to 35 years during 1981-1985, 1986-1990, and 1991-1995 were calculated from mortality data compiled by CDC and population data compiled by the Bureau of the Census. For each of the rate calculations, the numerator was the average annual number of deaths during the period and the denominator was the average of the five mid-year population estimates during the period. IHD deaths were defined as deaths for which the underlying cause was listed as codes 410.0-414.9 of the International Classification of Diseases, Ninth Revision (ICD-9). The cause of death is reported by attending physicians, medical examiners, or coroners on death certificates filed in state vital statistics offices. Age-adjusted IHD death rates for persons aged greater than or equal to 35 years were calculated by the direct method using the 1970 U.S. standard population. Age-specific death rates were calculated for 10-year age groups. Black:white mortality ratios were calculated by dividing the death rate for blacks by the death rate for whites. Black:white mortality ratios for each year during 1981-1995 also were examined and indicated the same trends as the average annual mortality ratios for the 5-year periods presented here. From 1981 through 1995, age-adjusted IHD death rates decreased for blacks and whites of both sexes (Table_1). The age-adjusted IHD mortality ratios for blacks compared with whites increased from 0.9 to 1.1 overall. For each time period, the age-adjusted black:white IHD mortality ratios were less than 1.0 for men and greater than 1.0 for women. The age-specific IHD death rates increased with increasing age for blacks and whites of both sexes (Table_1). The age-specific IHD mortality ratios were greater than 1.0 in younger age groups, where death rates for blacks exceeded those for whites, and were less than 1.0 in older age groups, where death rates for whites exceeded those for blacks. This crossover of mortality ratios occurred in different age groups for men and women. For example, during 1981-1985, the mortality ratios for men were less than 1.0 in the 65-74-year age group and those for women were less than 1.0 in the 75-84-year age group. In every age group, IHD death rates were greater for men than women, and age-specific black:white mortality ratios were greater for women than men. From 1981 through 1995, age-specific IHD death rates decreased for blacks and whites within each sex and age group except for black women aged greater than or equal to 85 years (Table_1). However, these decreases were greater for whites than blacks during this period, resulting in a greater disparity of IHD death rates between blacks and whites and in increasing black:white mortality ratios. The age-specific black:white mortality ratios increased in every age group overall, and the black:white mortality ratios increased across the three 5-year periods for men (Figure_1) and women (Figure_2) of every age group except the 35-44-year age group. This increase in the mortality ratios resulted in a shifting of the age groups at which death rates for blacks exceeded those for whites, such that the disparity between young blacks and whites extended into older age groups. For example, during 1981-1985, the total age-specific black:white mortality ratios remained greater than 1.0 until the 65-74-year age group, but during 1991-1995 these mortality ratios remained greater than 1.0 until the 75-84-year age group. Reported by: SL Huston, PhD, EJ Lengerich, VMD, E Conlisk, PhD, K Passaro, PhD, Chronic Disease Epidemiology and Evaluation Section, Div of Community Health, North Carolina Dept of Health and Human Svcs. Cardiovascular Health Br, Div of Adult and Community Health, National Center for Chronic Disease Prevention and Health Promotion, CDC. Editorial NoteEditorial Note: The findings in this report indicate that IHD death rates declined for all age groups during 1981-1995; however, these decreases were greater for whites than for blacks, causing an increase in the black:white IHD mortality ratios. Black: white mortality ratios were particularly high for young women; black women in the 35-44- and 45-54-year age groups experienced IHD death rates more than twice those of white women in the same age groups. Furthermore, the disparity in IHD death rates between blacks and whites in the younger age groups increased and extended into older age groups during this period. By 1991-1995, the black:white mortality ratios were less than 1.0 only in the 75-84- and greater than or equal to 85-year age groups for men and in the greater than or equal to 85-year age group for women. In addition, among the older age groups, where death rates for whites exceeded those for blacks, the gap appeared to be closing over time, with the black:white mortality ratios increasing toward 1.0. Since the mid-1970s, whites (especially white men) have experienced greater declines than blacks in age-adjusted IHD death rates (4-6). Although this report found that blacks had either similar or lower age-adjusted rates during 1981-1995, the age-specific rates for this period showed a notable race disparity for persons aged 35-64 years. Death rates for these younger age groups were considerably lower than those for older age groups. Nonetheless, the increased risk for IHD death among younger black men and women represents a substantial number of years of potential life lost. IHD death rates are affected by changes in modifiable risk factors associated with IHD and the successful diagnostic and treatment efforts in preventing mortality. The disparities in early IHD death rates by race in this report probably reflect differing distributions of risk factors (e.g., cigarette smoking, body weight, diabetes, and hypertension) and socioeconomic status (2). Other potential explanations for the increasing disparity between blacks and whites in premature IHD mortality include increasing differentials over time in the detection and treatment of IHD risk factors and in the quality of acute, in-hospital, and/or post-hospital medical care for IHD. In addition, the variation in physician, coroner, and medical examiner practices in reporting IHD on death certificates may have contributed to these differences. Compared with whites, blacks have a higher prevalence of some IHD risk factors (e.g., hypertension and diabetes) (6), are less likely to receive certain diagnostic and therapeutic coronary procedures (7,8), and may have a higher proportion of sudden and out-of-hospital deaths from IHD (9). Public health research and intervention efforts are needed to determine and address the underlying factors associated with the greater risk for IHD death among younger (aged less than 65 years) blacks than among younger whites and to address the slower decline in the IHD death rates among blacks of all ages. The continued monitoring of age-specific IHD mortality by race/ethnicity, continued monitoring of the prevalence of modifiable risk factors for IHD by race/ethnicity, and collection and analysis of population-based data on IHD incidence and treatment should be conducted to monitor the success of public health efforts to reduce IHD morbidity and mortality. Setting objectives for reductions in IHD mortality among persons aged less than 65 years also may be useful. CDC recently awarded funds to eight states to develop programs for the prevention of cardiovascular disease, including IHD. These programs will emphasize development of policies and environmental changes to reduce and prevent cardiovascular diseases. In particular, these programs will target cardiovascular diseases in minority and low-income populations. References
Table_1 Note: To print large tables and graphs users may have to change their printer settings to landscape and use a small font size.
TABLE 1. Age-specific death rates* and age-adjusted death rates+ for ischemic heart disease& among adults aged >=35 years,
by race, sex, and 5-year period; and black:white ratios of death rates, by sex and 5-year period -- United States, 1981-1995
=====================================================================================================================================
                                           Men                               Women                                Total
                               ------------------------------   ---------------------------------    --------------------------------
Age group                                         Black:White                        Black:White                         Black:White
 (yrs)              Period       Black    White      ratio        Black      White      ratio          Black     White      ratio
--------------------------------------------------------------------------------------------------------------------------------------
Age-specific
 35-44            1981-1985       59.0     41.0      1.44          20.9        7.8      2.68            38.2      24.3       1.58
                  1986-1990       46.3     31.2      1.49          16.0        6.2      2.59            30.0      18.7       1.61
                  1991-1995       38.1     25.6      1.49          15.5        5.8      2.69            26.0      15.7       1.66
 45-54            1981-1985      223.7    188.8      1.18          94.3       42.6      2.22           152.6     114.2       1.34
                  1986-1990      176.9    136.5      1.30          76.2       32.8      2.32           121.8      83.8       1.45
                  1991-1995      153.2    110.2      1.39          65.5       27.4      2.39           105.3      68.3       1.54
 55-64            1981-1985      552.0    523.1      1.06         291.4      165.4      1.76           406.9     333.9       1.22
                  1986-1990      464.4    412.0      1.13         248.1      138.1      1.80           343.0     268.0       1.28
                  1991-1995      405.7    334.4      1.21         210.7      115.9      1.82           295.7     220.6       1.34
 65-74            1981-1985     1082.1   1240.5      0.87         676.2      542.3      1.25           844.8     846.4       1.00
                  1986-1990      959.5    990.5      0.97         597.5      442.8      1.35           746.2     683.5       1.09
                  1991-1995      850.2    825.9      1.03         541.2      368.8      1.47           669.1     572.0       1.17
 75-84            1981-1985     2031.8   2761.3      0.74        1513.8     1656.6      0.91          1710.1    2063.6       0.83
                  1986-1990     1847.1   2315.9      0.80        1365.7     1388.4      0.98          1541.0    1733.1       0.89
                  1991-1995     1696.2   1961.3      0.86        1262.9     1174.4      1.08          1419.1    1476.1       0.96
  >=85            1981-1985     3729.0   6188.2      0.60        3259.5     4992.3      0.65          3415.8    5336.0       0.64
                  1986-1990     3667.6   5453.3      0.67        3325.0     4529.3      0.73          3426.1    4785.5       0.72
                  1991-1995     3575.1   4980.4      0.72        3291.1     4124.7      0.80          3373.9    4360.7       0.77
Age-adjusted
  >=35&           1981-1985      568.9    667.7      0.85         361.3      337.4      1.07         I 448.6   I 478.3      I0.94
--------------------------------------------------------------------------------------------------------------------------------------
* Per 100,000 population per year.
+ Per 100,000 population per year for persons aged >=35 years, age-adjusted to the 1970 U.S. standard population.
& International Classification of Diseases, Ninth Revision, codes 410.0-414.9.
======================================================================================================================================
Return to top. Figure_1  Return to top. Figure_2  Return to top. Disclaimer All MMWR HTML versions of articles are electronic conversions from ASCII text into HTML. This conversion may have resulted in character translation or format errors in the HTML version. Users should not rely on this HTML document, but are referred to the electronic PDF version and/or the original MMWR paper copy for the official text, figures, and tables. An original paper copy of this issue can be obtained from the Superintendent of Documents, U.S. Government Printing Office (GPO), Washington, DC 20402-9371; telephone: (202) 512-1800. Contact GPO for current prices. **Questions or messages regarding errors in formatting should be addressed to [email protected].Page converted: 11/12/98 |
|||||||||
This page last reviewed 5/2/01
|