 |
|
|
|
|
|
|
| ||||||||||
|
|
|
|
|
|
|
||||
| ||||||||||
|
|
|
|
|
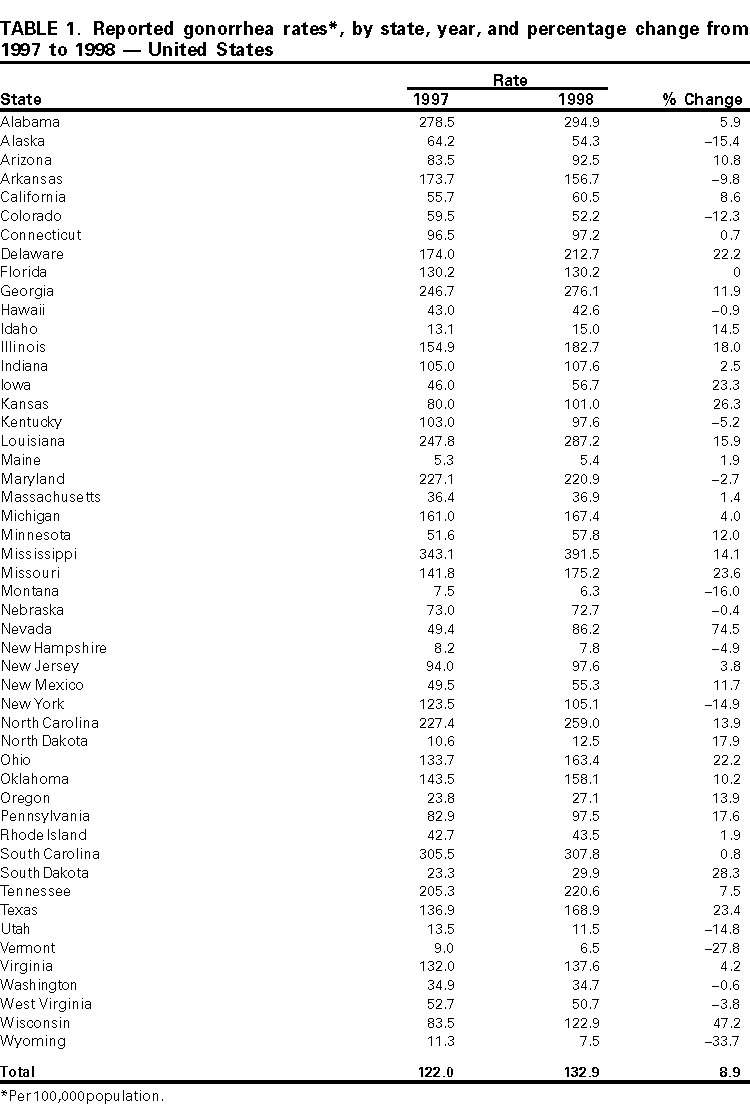
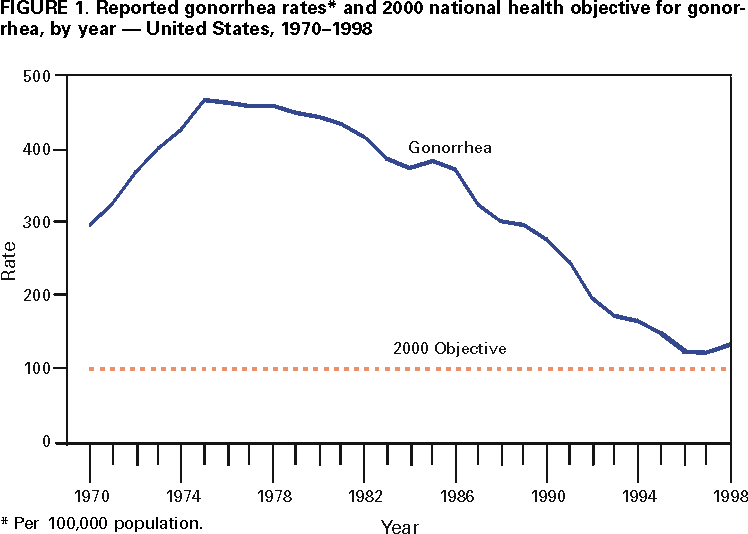
Persons using assistive technology might not be able to fully access information in this file. For assistance, please send e-mail to: [email protected]. Type 508 Accommodation and the title of the report in the subject line of e-mail. Gonorrhea --- United States, 1998Neisseria gonorrhoeae infections are a major cause of pelvic inflammatory disease, infertility, and ectopic pregnancy in women and facilitate the transmission of human immunodeficiency virus (1). To characterize the epidemiology of gonorrhea in the United States, CDC examined national surveillance data on gonorrhea cases reported to CDC through state health departments in 1998 and surveyed selected states with increases and decreases in gonorrhea rates since 1996. This report summarizes the results of this analysis, which indicate that following a 13-year decline, the number of gonorrhea cases in 1998 increased by 9% compared with 1997. Although changes in gonorrhea screening and surveillance practices may have contributed to the higher reported rates, reports from states suggest that true increases in gonorrhea cases also occurred in some populations. Surveillance data from the 50 states were used to determine trends in gonorrhea cases. Thirty states provided individual-level gonorrhea case reports that included age, sex, and race/ethnicity. The remaining states provided aggregate data with information by age group, sex, and race/ethnicity. Crude incidence was calculated annually per 100,000 population. Rates were calculated using postcensal population estimates (2); rates for 1998 used population estimates for 1997. Sexually transmitted disease (STD) program staff from states with a >10% increase in cases each year from 1996 to 1998 and those states with annual decreases during this period were interviewed about the trends in gonorrhea rates for their state. Questions addressed changes in gonorrhea screening policies, clinic testing volume, gonorrhea diagnostic test methods, and reporting practices. In 1998, 355,131 gonorrhea cases were reported to CDC (132.9 cases per 100,000 population) compared with 325,861 cases (121.8) in 1997 (Figure 1). From 1997 to 1998, the rate in the Midwest* increased by 16.4% (from 120.0 to 139.7), in the South by 8.7% (from 186.4 to 202.7), and in the West by 6.5% (from 50.6 to 53.9). In the Northeast, the gonorrhea rate declined by 0.8% (from 87.8 to 87.1). From 1997 to 1998, gonorrhea rates increased in 34 states (Table 1). In 1998 in 22 states, the rate was above the national health objective for 2000 of 100 cases per 100,000 population (Table 1), and represented 79% of gonorrhea cases reported in 1998. From 1997 to 1998, the gonorrhea rate increased 10.5% among women (from 119.2 to 131.7) and 7.4% among men (from 124.5 to 133.7). In 1998, the gonorrhea rate among non-Hispanic whites increased by 11.3% (from 18.6 to 20.7), among non-Hispanic blacks by 13.5% (from 593.1 to 673.1), among Hispanics by 15.9% (from 47.9 to 55.5), among American Indians/Alaska Natives by 17.0% (from 77.7 to 90.9), and among Asians/Pacific Islanders by 19.8% (from 13.1 to 15.7). Among women aged 15--19 years, the sex-age group with the highest rate of gonococcal infection, the rate increased by 11.4% (from 683.2 to 761.4). Among men aged 20--24 years, the rate increased by 11.3% (from 506.7 to 564.0). Idaho, Iowa, Louisiana, Mississippi, North Dakota, and Texas had annual increases of >10% in gonorrhea from 1996 to 1998. STD program managers in each state reported that changes in screening and reporting practices may have contributed to the increases. Increased gonorrhea rates reported from Iowa and Mississippi were attributed partly to increases in the numbers of persons screened by family planning clinics. In Louisiana and Texas, the increases were attributed to targeted screening efforts and improved access to STD clinic services. In three states, publicly funded screening programs switched from gonorrhea culture to nonculture tests; health departments in Iowa and Mississippi switched to using nucleic acid probe assays, and in North Dakota to ligase chain reaction tests. Louisiana expanded its case definition from accepting only reports from clinicians to also accepting laboratory reports. However, two states reported that they had true increases in gonorrhea cases in some populations; in Iowa, increases appeared among methamphetamine users and their sex partners, and in Texas, increases in gonorrhea test positivity were seen among women attending family planning clinics, even without a change in diagnostic test type, screening criteria, or number tested. Alaska, Arkansas, Kentucky, Maryland, and New Hampshire reported consecutive annual gonococcal infection decreases from 1996 to 1998. None of these states reported changes in testing methods or reporting practices. However, Kentucky reported that fewer women were attending family planning clinics, resulting in fewer screenings. In Alaska and New Hampshire, STD program managers attributed the declines in part to increases in presumptive treatment without laboratory testing. However, three states that reported declines had data on increases in gonococcal infections in specific populations, including men who have sex with men (MSM) (Alaska and New Hampshire) and drug users (Arkansas). In New Hampshire, 11.1% of gonorrhea cases were reported among MSM, compared with 6.6% in 1997 and 0% in 1996. Reported by: State and local health depts. Epidemiology and Surveillance Br, Statistics and Data Management Br and Program Development and Support Br, Div of Sexually Transmitted Disease Prevention, National Center for HIV, STD, and TB Prevention, CDC. Editorial Note:The increase in the reported rate of gonorrhea in 1998 followed an overall decline of 64.2% from 1985 to 1997 (3,4). A portion of the increase may be attributed to changes in screening and reporting practices. Data reported to the Regional Infertility Prevention Projects also showed that substantially more clinics were screening for gonorrhea during this period, and that they began to use nonculture methods for gonorrhea diagnosis (CDC, unpublished data, 1999). Under optimal conditions, the sensitivity of culture may be similar to nonculture methods (5,6); however, under field conditions, culture may be substantially less sensitive. Changes in screening and reporting practices probably did not account for all of the reported increases across states in 1998. For example, an investigation of the increase in South Dakota found that increased screening volume and change in testing methods accounted for 14% of the 80% increase in reported gonorrhea cases from 1997 to 1998 (7). In addition to Alaska and New Hampshire, reported increases in gonorrhea and other STDs among MSM have been documented in other states, possibly as a result of an increase in unsafe sexual behavior related to the availability of highly active antiretroviral therapy (8,9). The findings in this report are subject to at least three limitations. First, the quality of surveillance varies at the local and state levels. Second, STD reporting may be incomplete. Finally, reporting of gonorrhea may be biased toward the overreporting of infections among persons of minority races/ethnicities who attend public STD clinics. The degree to which this bias influences reported rates of gonorrhea is unknown. Race and ethnicity are not risk factors for disease, but markers used to better understand risk factors, and therefore, should be viewed within public health surveillance as a sociologic phenomenon (10). Following a series of transitions in diagnostic testing, screening practices, and surveillance methods, the decline in gonorrhea rates from 1985 to 1997 could resume; preliminary data suggest that in 1999, the gonorrhea rate is again declining. However, the overall number of gonorrhea cases remains high and the increasing rates of gonorrhea in some populations in 1998 should guide public health efforts to prevent this disease. References
*Northeast=Connecticut, Maine, Massachusetts, New Hampshire, New Jersey, New York, Pennsylvania, Rhode Island, and Vermont; Midwest=Illinois, Indiana, Iowa, Kansas, Michigan, Minnesota, Missouri, Nebraska, North Dakota, Ohio, South Dakota, and Wisconsin; South=Alabama, Arkansas, Delaware, Florida, Georgia, Kentucky, Louisiana, Maryland, Mississippi, North Carolina, Oklahoma, South Carolina, Tennessee, Texas, Virginia, and West Virginia; and West=Alaska, Arizona, California, Colorado, Hawaii, Idaho, Montana, Nevada, New Mexico, Oregon, Utah, Washington, and Wyoming. Table 1  Return to top. Figure 1  Return to top. Disclaimer All MMWR HTML versions of articles are electronic conversions from ASCII text into HTML. This conversion may have resulted in character translation or format errors in the HTML version. Users should not rely on this HTML document, but are referred to the electronic PDF version and/or the original MMWR paper copy for the official text, figures, and tables. An original paper copy of this issue can be obtained from the Superintendent of Documents, U.S. Government Printing Office (GPO), Washington, DC 20402-9371; telephone: (202) 512-1800. Contact GPO for current prices. **Questions or messages regarding errors in formatting should be addressed to [email protected].Page converted: 6/22/2000 |
|||||||||
This page last reviewed 5/2/01
|