 |
|
|
|
|
|
|
| ||||||||||
|
|
|
|
|
|
|
||||
| ||||||||||
|
|
|
|
|
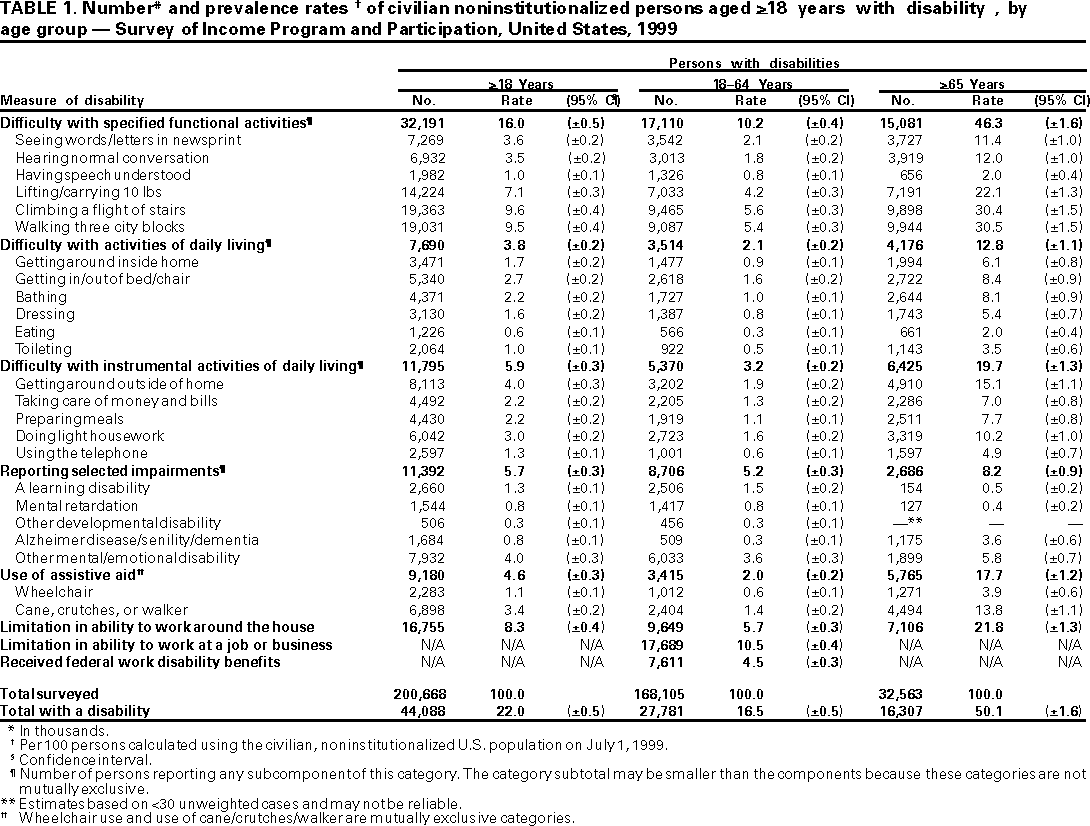
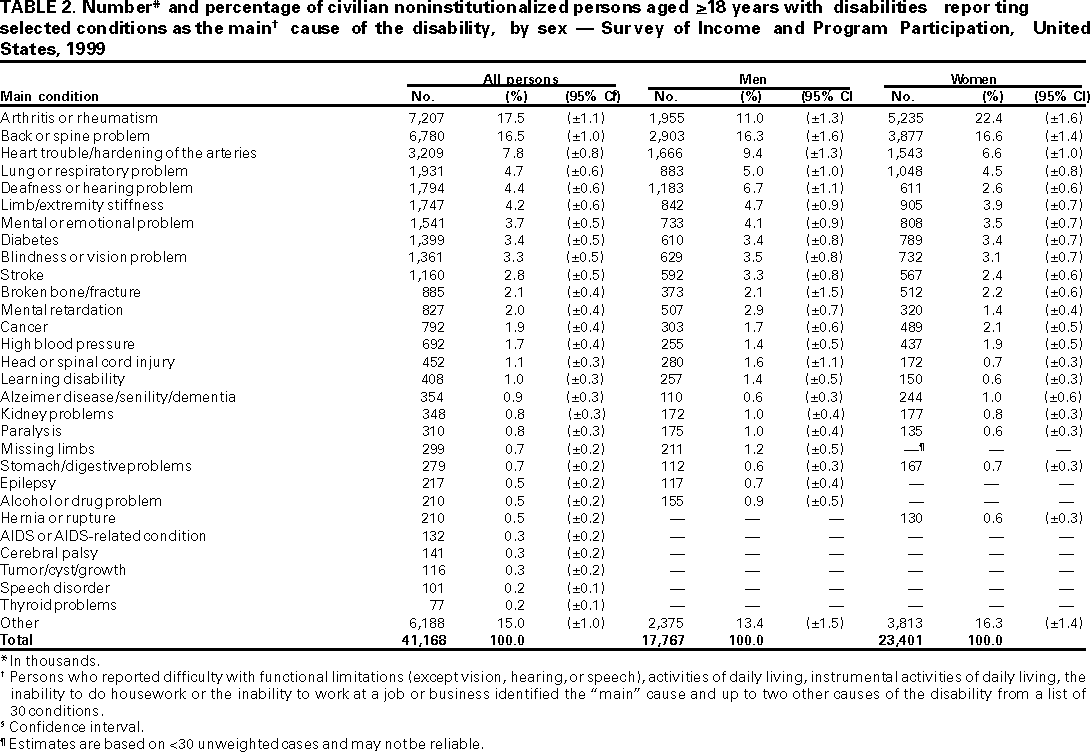
Persons using assistive technology might not be able to fully access information in this file. For assistance, please send e-mail to: [email protected]. Type 508 Accommodation and the title of the report in the subject line of e-mail. Prevalence of Disabilities and Associated Health Conditions Among Adults --- United States, 1999Please note: An erratum has been published for this article. To view the erratum, please click here. In the United States, the number of persons reporting disabling conditions increased from 49 million during 1991--1992 to 54 million during 1994--1995 (1--4). During 1996, direct medical costs for persons with disability were $260 billion (5). Surveillance of disability prevalence and associated health conditions is useful in setting policy, anticipating the service needs of health systems, assisting state programs, directing health promotion and disease prevention efforts, and monitoring national health objectives (6--8). The U.S. Bureau of the Census and CDC analyzed data from the Survey of Income and Program Participation (SIPP) to determine national prevalence estimates of adults with disabilities and associated health conditions. This report summarizes findings of that analysis, which indicate that disability continues to be an important public health problem, even among working adults, and arthritis or rheumatism, back or spine problems, and heart trouble/hardening of the arteries remain the leading causes. Better health promotion and disease prevention may reduce the prevalence of disability-associated health conditions. The 1996 SIPP panel was a multistage, stratified sample of the U.S. civilian, noninstitutionalized population based on the 1990 U.S. census. Panel members were interviewed 12 times in 4 years. During August--November 1999, the Adult Disability Topical Module of Wave 11 of the 1996 SIPP panel collected information about self-reported disability during personal interviews with persons in 36,700 households representative of the civilian, noninstitutionalized population aged >15 years. For this analysis, disability was defined as self-reported or proxy-reported difficulty with or reporting one or more of eight measures: 1) difficulty with one or more specified functional activities*; 2) difficulty with one or more activities of daily living (ADLs)*; 3) difficulty with one or more instrumental activities of daily living (IADLs)*; 4) reporting one or more selected impairments*; 5) use of assistive aids (e.g., wheelchair, crutches, cane, or walker) for >6 months; 6) limitation in the ability to work around the house; 7) limitation in the ability to work at a job or business (data for persons aged 16--67 years); and 8) receiving federal benefits on the basis of an inability to work. A subset of persons with disability also reported the main cause of their disability from a list of 30 associated health conditions. This subset, defined before the survey was conducted, comprised persons reporting difficulty with ADLs, IADLs, selected functional activities (excluding seeing, hearing, and having their speech understood by others), or limitation in the ability to work around the house or at a job or business. National estimates were calculated using sample weights representing the inverse of the probability for selection and complex adjustments for nonresponse and subsampling (6). The analysis focused on 53,636 adults aged >18 years (consistent with standard age categories used in other national surveys). In 1999, 44 million (22%) adults reported having a disability (Table 1). The prevalence rate of disability was 24% among women and 20% among men. Approximately 32 million adults had difficulty with one or more functional activities such as climbing a flight of stairs (19.4 million), walking three city blocks (19 million), or lifting/carrying 10 lbs (14.2 million); approximately 16.7 million adults had a limitation in the ability to work around the house; 11 million had either selected impairments or difficulty with IADLs. Two million adults used a wheelchair, and seven million used a cane, crutches, or a walker. Of the total percentage of disabilities, 63% occurred among working adults (aged 8--64 years); of these, 27.8 million (16.5%) had a disability and 17.7 million (10.5%) had a limitation in the ability to work at a job or business. Of those adults aged >65 years, 16.3 million (50%) had a disability. The age-specific prevalence rate of disability was the highest among respondents aged >65 for all functional activities, ADLs, and IADLs. Of all adults with disabilities, 41.2 million (93.4%) reported their main health condition associated with their disability (Table 2); 7.2 million (17.5%) had arthritis and rheumatism, 6.8 million (16.5%) had back or spine problems, and 3.2 million (7.8%) had heart trouble/hardening of the arteries. Women had higher rates in the arthritis or rheumatism and "other" associated health conditions categories than men. Men had higher rates of heart trouble/hardening of the arteries and deafness or hearing problems than women. Reported by: JM McNeil, J Binette, Bur of the Census, Economics and Statistics Administration, US Dept of Commerce. Disability and Health Br, Div of Birth Defects, Child Development, and Disability and Health, National Center for Environmental Health; Health Care and Aging Studies Br, Div of Adult and Community Health, National Center for Chronic Disease Prevention and Health Promotion, CDC. Editorial Note:Disability affects more than one in five adults. Rates of disability are higher among older adults who also have higher rates of chronic diseases. However, most disability occurs during the working years, which contributes to the high cost estimates of disability. Arthritis or rheumatism, back or spine problems, and heart trouble/hardening of the arteries continue to be the leading causes of disability. This report differs from a similar 1994 report by focusing on adults only and using a broader definition of disability (4). The strengths of SIPP include a survey design that allows nationally representative population estimates of disability. The broad definition of disability used in SIPP also provides a sensitive estimate of disability prevalence that is less likely to overlook persons with disability than other definitions (e.g., clinical or federal benefit program-based definitions). SIPP links disability with associated health conditions, providing information that usually is not available from other data sources. This information is important because many programs address disability prevention by disease or condition. The findings in this report are subject to at least five limitations. First, despite complex statistical adjustment procedures used to address nonresponse over time, these procedures may not have completely eliminated bias that resulted from nonresponse errors, especially in subgroup analyses. Second, this report excluded persons in institutions, in the military, and aged <18 years. Third, persons with multiple disabilities may attribute the main disability to the one most disabling at the time of the interview, which may result in inconsistent survey responses. Fourth, because of questionnaire design, the main associated health condition was determined for most but not all adults with disability; 2.9 million (6.4%) persons whose only disabilities were difficulty with vision, hearing, or speech, who had selected impairments, used assistive aids, or received federal disability benefits were not asked about a main condition. Finally, the definition of disability used did not assess environmental and social barriers, discrimination as the result of disability, and effects on the workforce. These issues are addressed in the International Classification of Functioning, Disability, and Health (ICIDH-2), a unified and standard framework that describes the dimensions of disability (9). ICIDH-2 complements the International Classification of Diseases by organizing information around three dimensions: body level (body systems and structure), person and society level (activities and participation), and the environment. Because of the dynamic quality of disability, a limitation in one dimension does not predict a limitation in another. These estimates demonstrate the large impact of disability in working age and older adults and the relative contributions of associated health conditions, and provide information for public health policy makers and health systems. More detailed analyses relating the eight measures of disability and associated health conditions can assist disease-specific efforts in planning, health promotion and disease prevention, and surveillance of disability-related national health objectives (10). With increasing life expectancy and the aging of the population, health issues related to disability are likely to increase in importance. References
* Specified functional activities: ability to see words or letters in ordinary newspaper print, hear normal conversations, have speech understood by others, lift/carry 10 lbs, climb a flight of stairs without resting, and walk three city blocks. ADLs: getting around inside the home, getting in/out of a bed/chair, bathing, dressing, and toileting. IADLs: getting around outside the home, taking care of money and bills, preparing meals, doing light housework, and using the telephone. Selected impairments: learning disability, mental retardation, other developmental disability, Alzheimer disease/senility/dementia, and other mental disabilities (3). Table 1  Return to top. Table 2  Return to top. Disclaimer All MMWR HTML versions of articles are electronic conversions from ASCII text into HTML. This conversion may have resulted in character translation or format errors in the HTML version. Users should not rely on this HTML document, but are referred to the electronic PDF version and/or the original MMWR paper copy for the official text, figures, and tables. An original paper copy of this issue can be obtained from the Superintendent of Documents, U.S. Government Printing Office (GPO), Washington, DC 20402-9371; telephone: (202) 512-1800. Contact GPO for current prices. **Questions or messages regarding errors in formatting should be addressed to [email protected].Page converted: 2/22/2001 |
|||||||||
This page last reviewed 5/2/01
|