 |
|
|
|
|
|
|
| ||||||||||
|
|
|
|
|
|
|
||||
| ||||||||||
|
|
|
|
|
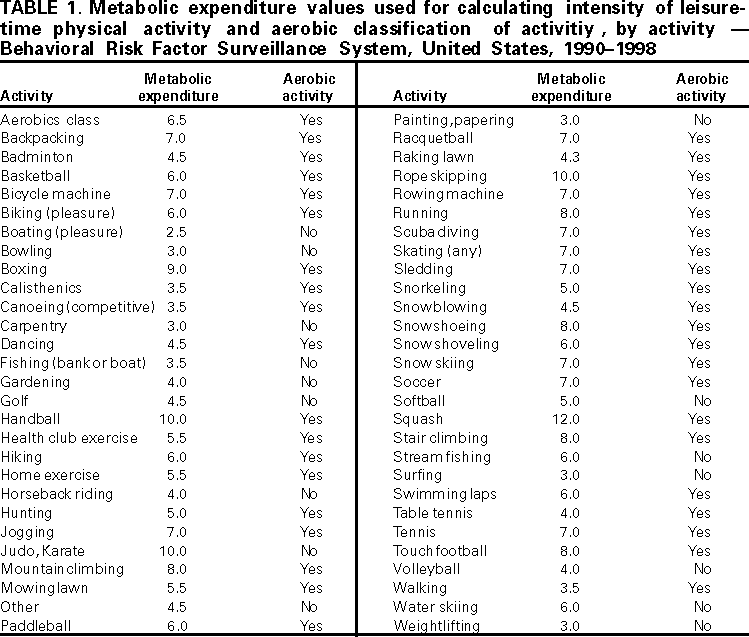
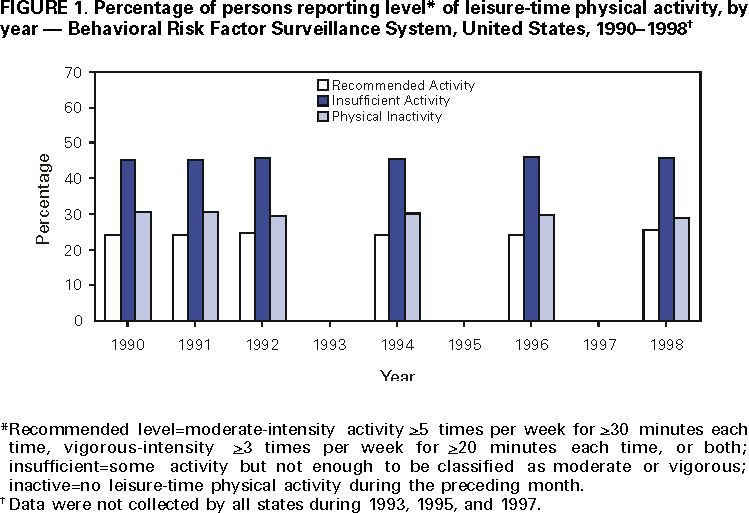
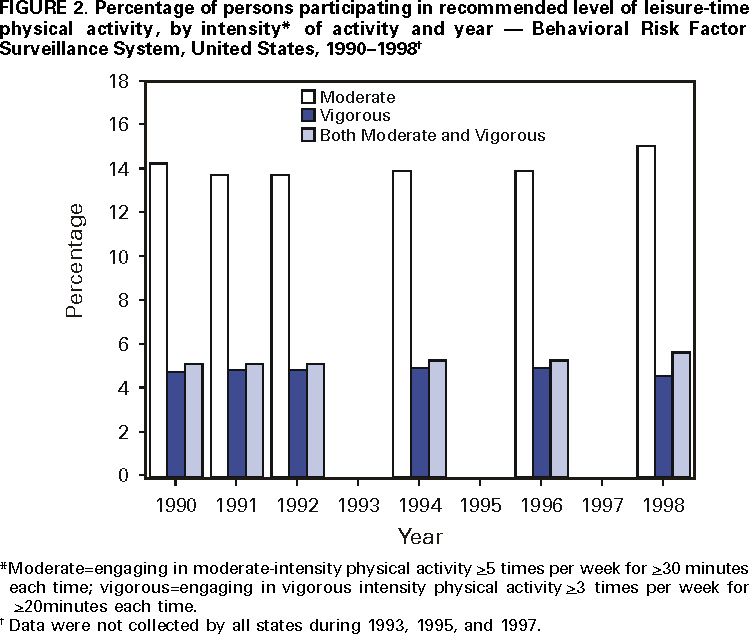
Persons using assistive technology might not be able to fully access information in this file. For assistance, please send e-mail to: [email protected]. Type 508 Accommodation and the title of the report in the subject line of e-mail. Physical Activity Trends --- United States, 1990--1998Physical activity is associated with numerous health benefits (1), and increased participation in various types of leisure-time physical activity had been encouraged during the 1990s (2). To determine national estimates of leisure-time physical activity during 1990--1998, data were obtained from the Behavioral Risk Factor Surveillance System (BRFSS). This report summarizes the results of that analysis, which indicate that leisure-time physical activity trends have remained unchanged. BRFSS is a population-based, random-digit--dialed telephone survey of the civilian, noninstitutionalized U.S. population aged >18 years. Forty-three states and the District of Columbia collected data about physical activity for 1990, 1991, 1992, 1994, 1996, and 1998. Data were not collected by all states during 1993, 1995, and 1997. Respondents were asked about the two physical activities or exercises they engage in most often and about the frequency, duration, and distance (as appropriate) of each activity. Responses were then classified as one of 56 selected activities (Table 1). Moderate activity was defined as any of the 56 selected activities, and vigorous activity was defined as aerobic physical activity classified as vigorous-intensity based on estimated metabolic expenditure (MET) (Table 1). To classify an activity as vigorous, it must be aerobic with an assigned MET value (3) that is at least 60% of a person's maximal cardiorespiratory capacity (MCC). MET values are determined using two regression equations for MCC (4): one for men (METS 60%MCC = [0.6 x (60 - 0.55 x age)]/ 3.5) and one for women (METS 60%MCC = [0.6 x (48 - 0.37 x age)]/ 3.5). To have achieved recommended levels of physical activity, a person must have reported engaging in moderate-intensity physical activity >5 times per week for >30 minutes each time, vigorous-intensity physical activity >3 times per week for >20 minutes each time, or both during the preceding month. Persons reporting some activity during the preceding month but not enough to be classified as moderate or vigorous were classified as insufficient. Persons classified as inactive reported no physical activity outside of their occupation during the preceding month. Data were analyzed using SUDAAN to obtain prevalence estimates for recommended levels of physical activity. All data were age adjusted to the 2000 standard population. The prevalence of those who engaged in recommended levels of activity increased slightly from 24.3% in 1990 to 25.4% in 1998, and the prevalence of those reporting insufficient activity increased from 45.0% in 1990 to 45.9% in 1998 (Figure 1). Those reporting no physical activity decreased from 30.7% in 1990 to 28.7% in 1998. The components of recommended activity remained relatively stable (Figure 2). Reported by: Physical Activity and Health Br, Div of Nutrition and Physical Activity, and Cardiovascular Health Br, Div of Adult and Community Health, National Center for Chronic Disease Prevention and Health Promotion; and an EIS Officer, CDC. Editorial Note:The findings in this report indicate that trends in physical activity remained stable during 1990--1998. Classifying persons according to their main pair of nonoccupational activities during the preceding month suggests that only approximately one fourth of U.S. adults meet recommended levels of physical activity. During 1990--1998, the BRFSS formula for calculating vigorous intensity changed. In 1992, vigorous intensity was calculated as 50% of MCC; before 1992, it was calculated as 60% of MCC, the generally accepted threshold for vigorous activity. The data reported here vary from previous reports (1) because all years of data were calculated using the same formula for vigorous intensity (60% MCC). Therefore, the slight increase in vigorous physical activity that might have appeared after 1992 in previous reports was attributed to differences in calculating vigorous physical activity rather than an actual increase among the population. The findings in this report are subject to at least four limitations. First, these data are self-reported and are subject to recall bias. Second, because these data do not include information on nonleisure-time physical activities, total activity may be underestimated. Third, only the two most common activities the respondents engaged in during the preceding month are reported. Finally, these data are limited by coverage- and nonresponse-related errors. Moderate-intensity physical activity has substantial health benefits (1). Moderate-intensity activities include housework, childcare activities, occupational activity, or walking for transportation, which may be more prevalent among women and certain subgroups of the population. However, surveillance systems that primarily are based on sports-related vigorous activities may miss a substantial portion of this type of activity. Also, systems based on only two reported activities may miss less intense or moderate-intensity activities. Public health programs usually encourage participation in moderate-intensity rather than vigorous-intensity activities for sedentary persons. Surveillance systems should be updated so that a broader range of physical activities can be measured. A more extensive measurement system would enable determination of whether the trends in this report are an accurate reflection of physical activity trends in the United States. References
Table 1  Return to top. Figure 1  Return to top. Figure 2  Return to top. Disclaimer All MMWR HTML versions of articles are electronic conversions from ASCII text into HTML. This conversion may have resulted in character translation or format errors in the HTML version. Users should not rely on this HTML document, but are referred to the electronic PDF version and/or the original MMWR paper copy for the official text, figures, and tables. An original paper copy of this issue can be obtained from the Superintendent of Documents, U.S. Government Printing Office (GPO), Washington, DC 20402-9371; telephone: (202) 512-1800. Contact GPO for current prices. **Questions or messages regarding errors in formatting should be addressed to [email protected].Page converted: 3/8/2001 |
|||||||||
This page last reviewed 5/2/01
|