 |
|
|
|
|
|
|
| ||||||||||
|
|
|
|
|
|
|
||||
| ||||||||||
|
|
|
|
|
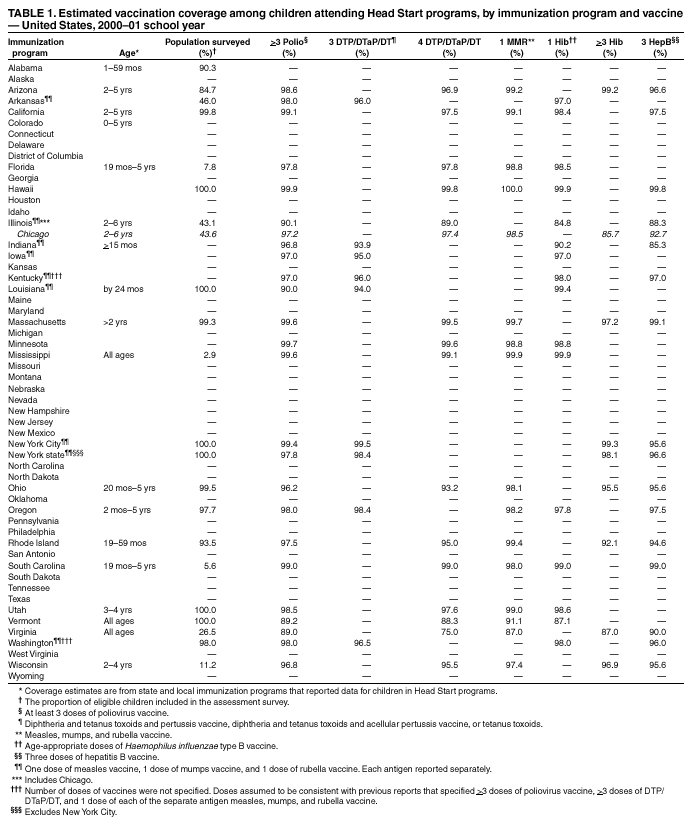
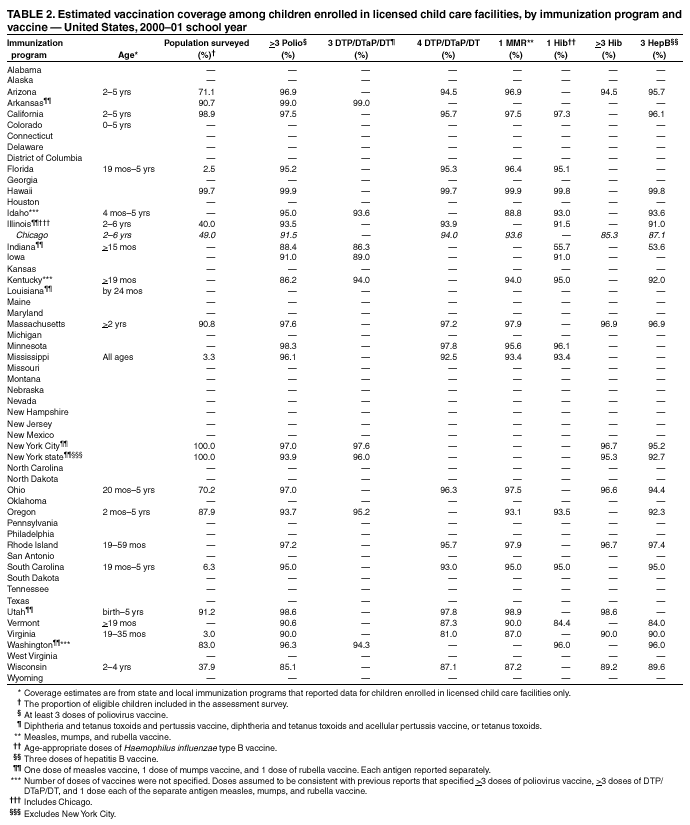
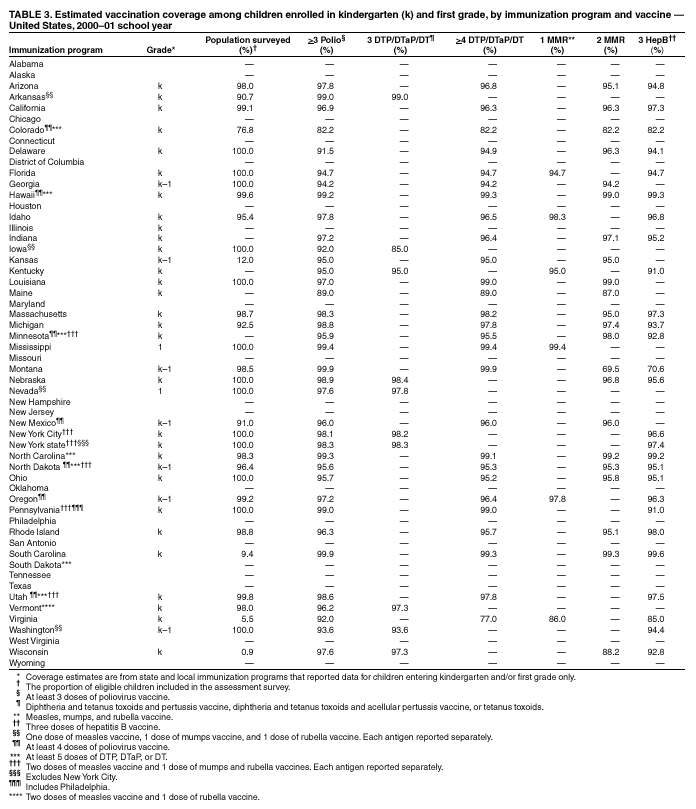
Persons using assistive technology might not be able to fully access information in this file. For assistance, please send e-mail to: [email protected]. Type 508 Accommodation and the title of the report in the subject line of e-mail. Vaccination Coverage Among Children Enrolled in Head Start Programs, Licensed Child Care Facilities, and Entering School --- United States, 2000--01 School YearThe implementation of state and local requirements for vaccination before entry to Head Start programs, licensed child care facilities, and school has resulted in high vaccination levels among preschool and school children (1,2). One of the national health objectives for 2010 is to maintain >95% vaccination coverage among children attending licensed child care centers and kindergarten through postsecondary school (objective 12-23) (3). National estimates of vaccination coverage among children in Head Start programs, licensed child care facilities, and those entering school have been published each year since 1997 on the basis of reports from federally funded immunization programs (IPs) in the 50 states, five cities, eight territories, and the District of Columbia (4). This report summarizes data reported by states, cities, and the District of Columbia for the 2000--01 school year. Although vaccination coverage for 2000--01 appears similar to that for previous years (4), the number of programs reporting and the completeness of the reports are lower than in previous years and do not permit precise estimation of coverage at the national level. IPs use school data to identify undervaccinated children enrolled in Head Start programs, licensed child care facilities, and those entering school; evaluate the success of prevention programs targeting these children; and document the proportion of children whose parents claim exemptions from one or more vaccines. Plans are ongoing to assist IPs in applying successful strategies for collecting, reporting, and increasing the precision of coverage estimates for these populations. Methods of assessing vaccination coverage differ among the 56 IPs, in part because state and local laws determine which vaccines and doses are required and because sampling and data abstraction methods vary. IPs used a standard one-page form to report the proportion (2.9 to 100% for Head Start and child care, 0.9 to 100% for kindergarten and first grade) of eligible children included in the assessment and coverage for each required vaccine. Head Start ProgramsOf the 56 IPs, 23 states, New York City, and Chicago (44.6%) reported vaccination coverage for children enrolled in Head Start programs (Table 1). All 25 programs reported coverage for >3 doses of poliovirus vaccine; 17 (30.4%) reported coverage for 3 doses of hepatitis B (HepB) vaccine; 16 (28.6%) reported coverage for 4 doses of diphtheria and tetanus toxoids and pertussis (DTaP) vaccine, 1 dose of measles, mumps, and rubella (MMR) vaccine, and 1 dose of Haemophilus influenzae type B (Hib) vaccine; and nine (16.1%) reported coverage for 3 doses of DTaP and for >3 doses of Hib. Of all 108 estimates of vaccination coverage reported for the Head Start group, 86 (79.6%) were >95%. Licensed Child Care FacilitiesOf the 56 IPs, 23 states, New York City, and Chicago (44.6%) submitted vaccination coverage levels for children enrolled in licensed child care (Table 2). All 25 programs reported coverage for >3 doses of poliovirus vaccine; 19 (33.9%) reported for 3 doses of HepB, 18 (32.1%) for 1 dose of MMR, 15 (26.8%) for 4 doses of DTaP, 14 (25.0%) for 1 dose of Hib, 10 (17.9%) for >3 doses of Hib, and nine (16.1%) for 3 doses of DTaP. Of all estimates of vaccination coverage for the child care age group (n = 110), 60 (54.5%) were >95%. Kindergarten/First GradeOf the 56 IPs, 36 states and New York City (66.1%) submitted vaccination coverage levels for children enrolled in kindergarten and/or first grade (Table 3). The number of programs reporting coverage varied by vaccine. All 37 programs reported coverage for >3 doses of poliovirus vaccine, 27 (48.2%) programs reported for 4 doses of DTaP and for 3 doses of HepB, 22 (39.3%) programs for 2 doses of MMR, 10 (17.9%) programs for 3 doses of DTaP, and six (10.7%) programs for 1 dose of MMR. Of all estimates of vaccination coverage reported for the kindergarten/first grade age group (n = 129), 99 (76.7%) were >95%. Reported by: L Barker, Data Management Div; M McCauley, Office of the Director, National Immunization Program; TL Fairley, PhD, EIS Officer, CDC. Editorial Note:Reported vaccination coverage for the 2000--01 school year for children in Head Start programs, licensed child care facilities, and those entering kindergarten and/or first grade appears similar to that reported in previous years. However, the number of programs reporting and the completeness of the reports are lower than in the past and do not permit coverage to be estimated reliably at the national level. For the 1999--2000 school year, eight territories were considered among the IPs. For the 2000--01 school year, no territories reported, resulting in a smaller number of IPs. In addition, some IPs that reported previously chose not to report for some facility types for the 2000--01 school year. These decreases in reporting and completeness from previous years might be attributed to a diversion of resources to other vaccination activities at both state and national levels. The findings in this report are subject to at least three limitations. First, approximately 40% of the states and cities did not submit 2000--01 vaccination coverage estimates. Second, variation in sampling methodology among IPs might limit the generalizability and comparability of these data (4). Finally, children attending private schools were not surveyed by all of the programs. Conducting regular assessments of vaccination coverage in group settings such as child care facilities and school are key in monitoring the impact of state requirements on vaccination coverage among U.S. children. These data are the only measure of vaccination coverage available for this population and the only data for measuring the 2010 national health objective. To assist state and local IPs in collecting and reporting coverage data for children in child care facilities and those entering school, CDC is developing a new reporting system that will improve data quality and facilitate the reporting process by automating many of the calculation/ data management tasks that IPs have previously performed manually. This automated system will decrease substantially the amount of personnel time devoted to producing annual reports. In addition, CDC has instituted a reminder system to alert IPs when reports are not submitted in a timely manner. These two approaches should facilitate participation from all IPs. References
Table 1  Return to top. Table 2  Return to top. Table 3  Return to top.
Disclaimer All MMWR HTML versions of articles are electronic conversions from ASCII text into HTML. This conversion may have resulted in character translation or format errors in the HTML version. Users should not rely on this HTML document, but are referred to the electronic PDF version and/or the original MMWR paper copy for the official text, figures, and tables. An original paper copy of this issue can be obtained from the Superintendent of Documents, U.S. Government Printing Office (GPO), Washington, DC 20402-9371; telephone: (202) 512-1800. Contact GPO for current prices. **Questions or messages regarding errors in formatting should be addressed to [email protected].Page converted: 3/6/2003 |
|||||||||
This page last reviewed 3/6/2003
|