 |
|
|
|
|
|
|
| ||||||||||
|
|
|
|
|
|
|
||||
| ||||||||||
|
|
|
|
|
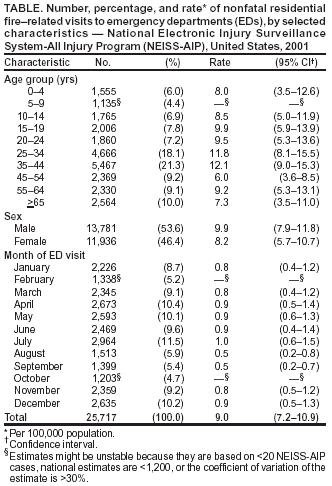
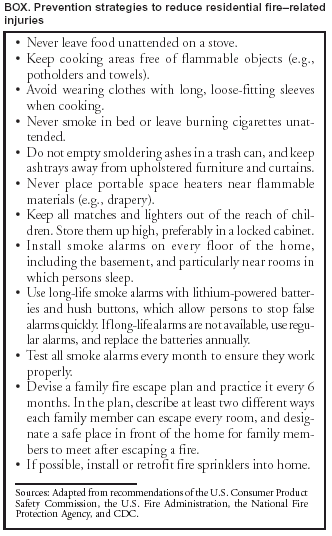
Persons using assistive technology might not be able to fully access information in this file. For assistance, please send e-mail to: [email protected]. Type 508 Accommodation and the title of the report in the subject line of e-mail. Nonfatal Residential Fire--Related Injuries Treated in Emergency Departments --- United States, 2001During 2000, the most recent year for which national mortality data are available, 3,907 persons died in the United States from fire-related injuries; residential fires accounted for 2,955 (76%) of these deaths (1). The National Fire Protection Association (NFPA) reported that approximately 396,500 residential fires occurred in 2001 (2). Injuries from residential fires are preventable by improving awareness of the common causes of fires and by using simple interventions (e.g., properly maintained smoke alarms [3] and fire escape plans). Surveillance of fire-related injuries can aid prevention by increasing the understanding of these injuries and by identifying at-risk populations to target for interventions and education. To characterize nonfatal residential fire--related injuries treated in U.S. hospital emergency departments (EDs) during 2001, CDC analyzed data from the National Electronic Injury Surveillance System-All Injury Program (NEISS-AIP). This report summarizes the results of that analysis, which indicate that, in 2001, an estimated 25,717 nonfatal residential fire--related injuries were treated in U.S. hospital EDs. Fire prevention and safety interventions and education should target at-risk populations for fire-related injuries. NEISS-AIP is operated by the U.S. Consumer Product Safety Commission (CPSC) and collects data about initial visits for all types and causes of injuries treated in U.S. EDs (4). NEISS-AIP data are drawn from a nationally representative subsample of 66 of 100 NEISS-AIP hospitals selected as a stratified probability sample of hospitals in the United States and its territories with a minimum of six beds and a 24-hour ED. NEISS-AIP provides data on approximately 500,000 injury- and consumer product--related ED cases each year. Data for each case include a comment variable that contains additional information about the circumstances of the injury. Each case was assigned a sample weight based on the inverse probability of selection. These weights were added to provide national estimates of residential fire--related episodes. Confidence intervals (CIs) were calculated by using a direct variance estimation procedure that accounted for the sample weights and complex sample design. Rates were calculated by using 2001 U.S. Census bridged-race population estimates from the National Center for Health Statistics (5). This analysis included ED patients treated for injuries incurred from unintentional residential fires. Only injuries with a specified location inside a residence were included. NEISS-AIP comment variables were reviewed for 772 patients whose injury was flame-related; for 656 (85%) patients, the location of the fire was identified. Patients were excluded if the episode involved only smoke or a flash fire, if the injuries were not the result of flames (e.g., scalds, hot surface burns, chemical burns, or electrical burns), or if the injury occurred outside a residence. Injuries to firefighters also were not included in the analysis. Patients who were dead on arrival or who died in EDs also were excluded. National estimates were based on weighted data for the 423 patients with injuries consistent with the case definition. For 2001, an estimated 25,717 (95% CI = 20,443--30,991) residential fire--related injuries were treated in U.S. hospital EDs (rate: 9.0 per 100,000 population; 95% CI = 7.2--10.9) (Table). Rates were slightly higher for males (9.9; 95% CI = 7.9--11.8) than for females (8.2; 95% CI = 5.7--10.7). Persons aged 35--44 years had similar rates of ED visits (12.1; 95% CI = 9.0--15.3) as persons aged 25--34 years (11.8; 95% CI = 8.1--15.5). In 2001, the number of cases was highest in July (2,964; 95% CI = 1,616--4,312) and lowest in October (1,203; 95% CI = 513--1,893). Overall, 5.9% (95% CI = 2.9%--8.9%) of persons with residential fire--related injuries were hospitalized. For all patients, 54.5% (95% CI = 38.3%--70.8%) had a principle diagnosis of anoxia (carbon monoxide poisoning and smoke inhalation), compared with 45.5% (95% CI = 29.2%--61.7%) with a diagnosis of burn. Among burn patients, the most common body parts affected were arm/hand (41.3%; 95% CI = 29.7%--53.0%) and head/neck (20.9%; 95% CI = 12.7%--29.1%). Reported by: K Blindauer, DVM, J Gilchrist, MD, Div of Unintentional Injury Prevention, National Center for Injury Prevention and Control; MF Ballesteros, PhD, EIS Officer, CDC. Editorial Note:The findings in this report indicate that an estimated 25,717 residential fire--related injuries were treated in U.S. EDs in 2001. This is the first report of nationally representative, nonfatal, residential fire--related injuries based on ED data. Although common injuries included anoxia and burns, patients with fire-related injuries also are at risk for having nonphysical injuries related to mental health (e.g., post-traumatic stress disorder) (6). These emotional consequences can have a lasting impact, especially on children (7). Findings from NFPA data, which indicate that an estimated 15,575 civilians were injured in residential fires in 2001 (2), were 40% less than estimates in this report. These differences were expected because NFPA estimates were derived from the 2001 National Fire Experience Survey, which collected data from a representative sample of fire departments across the country and not from direct patient information. Injuries from unreported fires, fires that were attended solely by volunteer private fire brigades, or fires extinguished by fixed suppression systems without fire department response are not included in NFPA estimates. According to NFPA, the leading causes of residential fires (including those without injury) are cooking equipment, heating equipment, incendiary devices or suspicious origins, electrical distribution equipment, and other equipment (8). For fires that involved an injury or death, smoking-related materials were the leading cause of fire-related deaths and the third leading cause of fire-related injuries, after cooking equipment and children playing with fire materials (8). The findings in this report are subject to at least six limitations. First, this report captured only injuries treated in hospital EDs and did not include injuries for which ED care was not received. Second, NEISS-AIP does not provide information about outcomes after ED discharge. Third, NEISS-AIP narrative descriptions do not provide detailed information consistently about the circumstances and mechanisms of fires. Fourth, NEISS-AIP is designed to provide national estimates and does not provide state or local estimates. Fifth, because of small case numbers, NEISS-AIP data from 2001 do not allow for calculation of injury rates by race/ethnicity. Finally, because the locations where 15% of fire-related injuries occurred were not identified, the national estimates of such injuries probably are underestimated. The U.S. Fire Administration (USFA), CPSC, CDC, and several nongovernment organizations are collaborating to prevent residential fires in the United States with the goal of eliminating residential fire--related deaths by 2020. Several prevention strategies can reduce the morbidity and mortality associated with residential fires (Box). Since 1998, CDC has funded smoke alarm installation and fire safety education programs in communities at high risk for fires. Through these programs, approximately 194,000 homes have been canvassed, and an estimated 142,000 smoke alarms have been installed. NFPA is sponsoring Fire Prevention Week during October 5--11, 2003. Additional information about residential fire safety and prevention is available through NFPA at http://www.nfpa.org, USFA at http://www.usfa.fema.gov, and CDC at http://www.cdc.gov/ncipc/duip/spotlite/fire_prevention.htm. Acknowledgments This report was based on data contributed by JL Annest, PhD, Office of Statistics and Programming; E Sogolow, PhD, Div of Unintentional Injury Prevention, National Center for Injury Prevention and Control, CDC. References
Table  Return to top. Box  Return to top.
Disclaimer All MMWR HTML versions of articles are electronic conversions from ASCII text into HTML. This conversion may have resulted in character translation or format errors in the HTML version. Users should not rely on this HTML document, but are referred to the electronic PDF version and/or the original MMWR paper copy for the official text, figures, and tables. An original paper copy of this issue can be obtained from the Superintendent of Documents, U.S. Government Printing Office (GPO), Washington, DC 20402-9371; telephone: (202) 512-1800. Contact GPO for current prices. **Questions or messages regarding errors in formatting should be addressed to [email protected].Page converted: 9/25/2003 |
|||||||||
This page last reviewed 9/25/2003
|