 |
|
|
|
|
|
|
| ||||||||||
|
|
|
|
|
|
|
||||
| ||||||||||
|
|
|
|
|
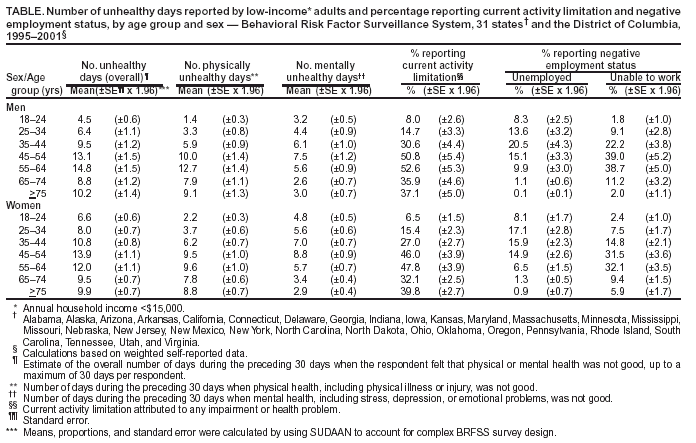
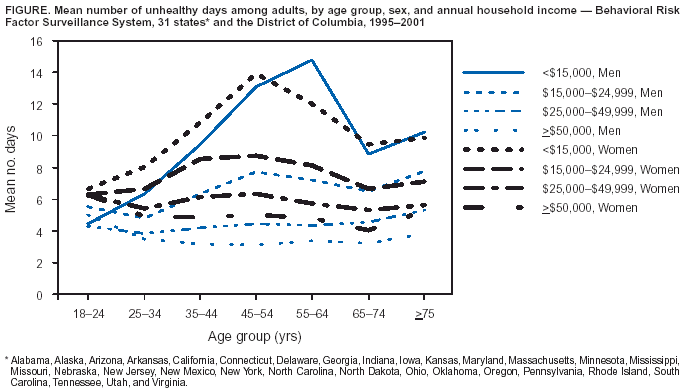
Persons using assistive technology might not be able to fully access information in this file. For assistance, please send e-mail to: [email protected]. Type 508 Accommodation and the title of the report in the subject line of e-mail. Public Health and Aging: Health-Related Quality of Life Among Low-Income Persons Aged 45--64 Years --- United States, 1995--2001Health-related quality of life (HRQOL) data are used to track population trends, identify health disparities, and monitor progress in achieving national health objectives for 2010 (1). Low-income (i.e., annual household income of <$15,000) adults aged >55 years have substantially more unhealthy days than low-income adults aged >65 years and adults aged 55--64 years with higher incomes (2). To verify this finding and determine whether it extends to low-income adults at younger ages, CDC analyzed HRQOL and related factors among a subset of respondents to the 1995--2001 Behavioral Risk Factor Surveillance System (BRFSS) surveys. This report summarizes the results of that analysis, which found that low-income adults aged 45--64 years have worse HRQOL than all other adults. Unemployment, inability to work, and activity limitation partially explain these HRQOL disparities in this age-income group. Targeting these risk factors and improving access to health care and social services (e.g., job training programs) could help increase the quality and years of healthy life and eliminate health disparities for persons in this age group. BRFSS is an ongoing, state-based, random-digit--dialed telephone survey of the U.S. noninstitutionalized civilian population aged >18 years (3). This subset included 248,783 respondents (52% female) from the District of Columbia and the 31 states* that used standard BRFSS HRQOL questions and an expanded BRFSS HRQOL module for >1 year during 1995--2001. These HRQOL measures have demonstrated reliability and validity for population health surveillance (4,5). The measures include physically unhealthy days (i.e., number of days during the 30 days preceding the survey when physical health was not good because of physical illness or injury) and mentally unhealthy days (i.e., number of days during the 30 days preceding the survey when mental health was not good because of stress, depression, or emotional problems). Unhealthy days represent the estimated overall number of days during the preceding 30 days when respondents believed their physical or mental health was not good, up to a maximum of 30 days. Data were weighted to estimate the population parameters. Unadjusted and adjusted means, proportions, linear regression coefficients, and standard errors were calculated by using SUDAAN to account for the complex BRFSS survey design. The <$15,000 annual household income group was selected to include the majority of adults at the poverty level and to permit adequate sample size for subset analysis. During 1995--2001, women in this population reported a mean of 6.4 unhealthy days, compared with 4.7 unhealthy days for men. In the higher income groups (i.e., annual household income of >$15,000) (Figure), women consistently reported more unhealthy days than men. However, this difference was not observed among adults aged 45--64 years in the lowest income group (Table). Persons aged 45--64 years with low income reported 7.1 more physically unhealthy days, 4.2 more mentally unhealthy days, and 8.2 more overall unhealthy days than those in the same age group with higher income. Among persons with the lowest incomes, men aged 55--64 years had the highest mean number of unhealthy days (14.8), followed by women aged 45--54 years (13.9). Men and women aged >25 years consistently reported more unhealthy days at progressively lower income levels within each age group; differences in unhealthy days within sex-income groups were largest for men aged 55--64 years (11.4 days). Most sex-income groups reported only modest variation with age (Figure), but the lowest income group showed an anomalous pattern of unhealthy days with older age, rising to substantially higher levels for persons aged 45--54 years and those aged 55--64 years and declining sharply at ages 65--74 years. Among persons with annual household income of <$15,000, adults aged 45--54 years had the highest mean number of mentally unhealthy days (8.3), whereas similarly aged adults with annual household income of >$15,000 had a mean of 2.9 mentally unhealthy days. To determine which demographic and personal characteristics among persons aged 45--64 years with annual household income of <$15,000 were associated with unhealthy days most strongly, multiple linear regression was used to predict unhealthy days with these characteristics as independent variables. Employment status and activity limitation accounted for the most variability in unhealthy days (34.8% among men and 32.1% among women). Including race/ethnicity, education, health-care coverage, and marital status in an expanded linear regression model accounted for only slightly more variability in unhealthy days (36.3% among men and 33.4% among women). Nearly half (48.8%) of respondents aged 45--54 or 55--64 years with the lowest income reported a current activity limitation, and nearly one third (34.6%) reported being unable to work (Table). Reported by: HS Zahran, MD, Association of Teachers of Preventive Medicine, Atlanta, Georgia. DG Moriarty, MM Zack, MD, R Kobau, MPH, Div of Adult and Community Health, National Center for Chronic Disease Prevention and Health Promotion, CDC. Editorial Note:Persons aged 45--64 with annual household income of <$15,000 have substantially worse HRQOL. This finding confirms previous findings that adults in their preretirement years (aged 55--64 years) with the least education and lowest income report more unhealthy days than older adults with similar education and income (2). Employment status and activity limitation accounted for nearly one third of the variability in mean unhealthy days reported by adults aged 45--64 years with annual household income of <$15,000. These findings also are consistent with several other studies relating socioeconomic status (SES) and employment status to health (6--9). SES shapes exposure to many psychosocial, environmental, behavioral, and biomedical risk factors that directly and indirectly affect mental and physical health (9). Low-income adults aged 45--64 years in whom chronic health conditions and activity limitations develop at earlier ages might benefit from health and social services (2). Both men and women with low incomes report substantial numbers of unhealthy days, unlike other income groups, in which women typically report worse health than men. Persons with lower SES are known to report lower perceived control over life events, including health-related behaviors (10). Perception of less control might underlie adverse coping mechanisms and risky behaviors related to higher reported numbers of unhealthy days for both men and women in this income group. This study also found that adults aged 45--54 years with annual household income of <$15,000 had the highest mean number of mentally unhealthy days. The high levels of unemployment, inability to work, and activity limitation among adults in this age-income group could affect mental health adversely (6,7). The findings in this report are subject to at least five limitations. First, because BRFSS surveys only noninstitutionalized adults by telephone, persons in institutions and households without telephones, both of whom might have worse HRQOL than others, are excluded (3). Second, whether poor HRQOL precedes being unemployed or being unable to work, or whether being unemployed or unable to work precedes poor HRQOL could not be determined. Third, demographic, socioeconomic, and activity limitation variables explained only approximately one third of the variability in unhealthy days in the lowest income group of persons aged 45--64 years. Other factors (e.g., behaviors, physical and social environment, psychosocial factors, health conditions, and unmeasured socioeconomic factors) could account for much of the remaining variability. Fourth, because not all states interviewed respondents with the optional BRFSS HRQOL module intermittently during the study period, these findings might not be generalizable to other states or to other periods. Finally, because 16% of BRFSS respondents either did not know or refused to report their annual household incomes, these findings might not be generalizable to all groups. Low-income adults aged 45--64 years report more physically and mentally unhealthy days than younger and older low-income adults and higher income adults of the same ages. Unemployment, inability to work, and activity limitation accounted for some of these differences. Targeting these risk factors and improving access to health care (e.g., Medicaid and rehabilitation programs) and social services (e.g., job training programs) could help increase the quality and years of healthy life and eliminate health disparities for persons in this age group. Acknowledgments This report is based on data contributed by state BRFSS coordinators. The project was supported under a cooperative agreement from CDC through the Association of Teachers of Preventive Medicine. References
* Alabama, Alaska, Arizona, Arkansas, California, Connecticut, Delaware, Georgia, Indiana, Iowa, Kansas, Maryland, Massachusetts, Minnesota, Mississippi, Missouri, Nebraska, New Jersey, New Mexico, New York, North Carolina, North Dakota, Ohio, Oklahoma, Oregon, Pennsylvania, Rhode Island, South Carolina, Tennessee, Utah, and Virginia.
Table  Return to top. Figure  Return to top.
Disclaimer All MMWR HTML versions of articles are electronic conversions from ASCII text into HTML. This conversion may have resulted in character translation or format errors in the HTML version. Users should not rely on this HTML document, but are referred to the electronic PDF version and/or the original MMWR paper copy for the official text, figures, and tables. An original paper copy of this issue can be obtained from the Superintendent of Documents, U.S. Government Printing Office (GPO), Washington, DC 20402-9371; telephone: (202) 512-1800. Contact GPO for current prices. **Questions or messages regarding errors in formatting should be addressed to [email protected].Page converted: 11/20/2003 |
|||||||||
This page last reviewed 11/20/2003
|