 |
|
|
|
|
|
|
| ||||||||||
|
|
|
|
|
|
|
||||
| ||||||||||
|
|
|
|
|
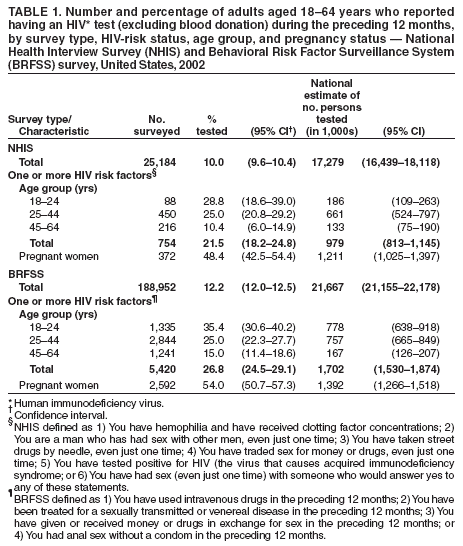
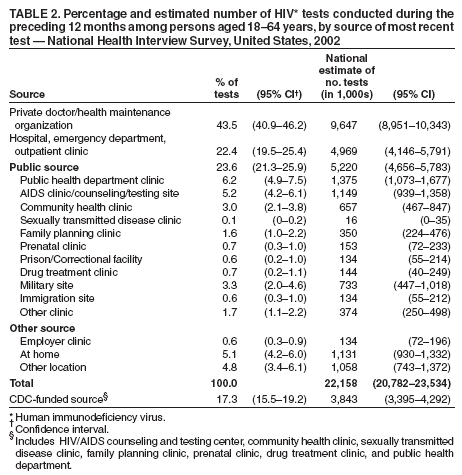
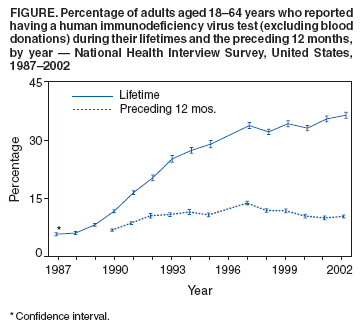
Persons using assistive technology might not be able to fully access information in this file. For assistance, please send e-mail to: [email protected]. Type 508 Accommodation and the title of the report in the subject line of e-mail. Number of Persons Tested for HIV --- United States, 2002Strategies for preventing infection with human immunodeficiency virus (HIV) emphasize testing to identify infected persons and ensure access to appropriate medical care, treatment, and prevention services (1). To determine the number of persons who were tested for HIV during the preceding 12 months, CDC analyzed data from both the 2002 National Health Interview Survey (NHIS) and the 2002 Behavioral Risk Factor Surveillance System (BRFSS) survey. This report summarizes the results of these analyses, which indicated that, in 2002, approximately 10%--12% of persons aged 18--64 years in the United States reported being tested for HIV during the preceding 12 months, an estimated 16--22 million persons. Continued measurement of HIV testing by health surveys such as BRFSS and NHIS can be used in combination with program data and other surveys of populations at high risk to determine the impact of HIV strategies on increasing testing. NHIS is a stratified, multistage probability sample survey representing the U.S. civilian, noninstitutionalized population (2). The estimates in this analysis were based on personal interviews with a nationally representative sample of 31,044 adults aged >18 years; the overall survey response rate was 74.3%. BRFSS is an ongoing, state-based, random-digit--dialed telephone survey of the U.S. civilian, noninstitutionalized population aged >18 years (3). In 2002, the median state/area response rate was 58.3% (range: 42.2%--82.6%) (4). State data from BRFSS are often combined to produce national estimates. In 2002, a total of 188,952 adults aged 18--64 years were asked questions about HIV testing. In both surveys respondents were asked whether they had ever been tested for HIV and, if "yes," the month and year of the most recent test; both surveys asked respondents to exclude tests that occurred through blood donations. Questions on NHIS used to estimate trends in the percentage tested during the preceding 12 months have changed over time. Neither survey asked about specific HIV-risk behaviors, but both asked respondents to state whether an identified risk category applied to them, without stating which category (Table 1). This analysis excluded HIV tests that were performed when persons donated blood. All other tests were counted, including those that were required (e.g., for employment, insurance, or military service) and those that were obtained to determine infection status. Persons with missing HIV testing data (about 4% of persons interviewed in the two surveys) were included in the denominator. Estimates were weighted for unequal selection probabilities and nonresponse. Statistical software was used to adjust for the effects of the complex sampling design. Results from NHIS indicated an increase in the percentage of respondents during 1987--2002 who had been tested during their lifetimes (Figure). In 2002, 37.8% of adults aged 18--64 years (95% confidence interval [CI] = 37.0%--38.6%) reported that they had been tested for HIV at least once in their lifetimes, compared with 5.7% in 1987 (CI = 5.3%--6.1%). In addition, in 2002, 10.0% of adults aged 18--64 years reported having been tested during the preceding 12 months, a percentage equivalent to an estimated 16--18 million persons tested nationally (Table 1). Persons tested during the preceding 12 months reported being tested, on average, 1.28 times (range: one to 24 times), a ratio equivalent to an estimated 21--24 million HIV tests per year for persons aged 18--64 years. BRFSS data provided similar estimates of the percentages of persons tested. Results indicated that among adults aged 18--64 years, 43.5% (CI = 43.1%--43.9%) reported having been tested at least once in their lifetimes, and 12.2% reported having been tested during the preceding 12 months, a proportion equivalent to an estimated 21--22 million persons tested (Table 1). In both surveys, greater percentages of pregnant women and persons at increased risk for HIV reported being tested during the preceding 12 months than other persons. According to NHIS and BRFSS data, approximately 48.4% and 54.0% of pregnant women, respectively, reported HIV tests. Among persons at increased risk for HIV, NHIS and BRFSS data indicated 21.5% and 26.8%, respectively, reported HIV tests (Table 1). Among those at increased risk, the percentage tested during the preceding 12 months was greater among younger age groups in both surveys. According to NHIS data, 28.8% of those aged 18--24 years were tested, compared with 10.4% of those aged 45--64 years; according to BRFSS data, 35.4% of those aged 18--24 years were tested, compared with 15.0% of those aged 45--64 years. Data from the 2002 NHIS interviews regarding the most recent HIV tests indicated the majority of tests were obtained from physicians and health-maintenance organizations (43.5%) or hospitals (22.4%) (Table 2). Of 5.1% of tests reported as taking place "at home," 93.4% (CI = 88.2%--98.5%) were administered by a nurse or health-care worker. Testing sources that usually receive public funding (e.g., public health department clinics, family planning clinics, and prenatal clinics) accounted for 23.6% of tests during the preceding 12 months. Sources of HIV testing (Table 2) typically funded by CDC's HIV-prevention programs accounted for 17.3% of the tests, yielding an estimated 3.4 million to 4.3 million tests. Reported by: JE Anderson, PhD, Div of HIV/AIDS Prevention, National Center for HIV, STD, and TB Prevention. Editorial Note:HIV testing is an integral part of current approaches to HIV prevention, which seek to expand testing practices, making HIV tests part of routine medical care and also more widely available outside of medical settings (1). However, as NHIS data indicate, the percentage of adults reporting new HIV tests each year has remained fairly constant at 10%--12% for more than a decade. The findings in this report are subject to at least three limitations. First, persons aged <18 years and those not living in households were not interviewed. Second, because testing was self-reported and subject to recall bias, errors are possible in reporting whether tests occurred and the date and source of the tests. NHIS and BRFSS take steps to minimize the effects of these potential errors, including pretesting of questionnaires to ensure comprehension and accuracy of reporting and by using weighting factors to compensate for nonresponse. Finally, measures of behavioral or exposure HIV risk might not include all persons at increased risk and might include persons who are no longer at risk. Nevertheless, the indirect risk measures are associated with recent HIV testing. NHIS and BRFSS surveys yield similar results despite using different methodologies. HIV-prevention strategies emphasize testing because many infected persons are unaware of their status or became aware late in their infection (5,6). Despite recommendations of universal voluntary testing during pregnancy, in recent years, an estimated 20%--40% of pregnant women were not tested (7,8). Persons who are at high priority for receiving HIV testing (e.g., those at increased risk or pregnant) reported testing at rates higher than the general population; however, many members of these priority groups were not tested during the preceding 12 months. CDC's Advancing HIV Prevention initiative encourages testing for HIV by making voluntary testing a routine part of regular medical care, by offering rapid HIV testing in nonclinical settings (e.g., outreach into communities at high risk), and by making HIV testing part of the routine battery of prenatal tests for all pregnant women, unless declined (i.e., the "opt-out" approach). Continued surveys of HIV testing can help assess the success of these and other programs aimed at increasing the percentage of persons tested for HIV. References
Table 1  Return to top. Table 2  Return to top. Figure  Return to top.
Disclaimer All MMWR HTML versions of articles are electronic conversions from ASCII text into HTML. This conversion may have resulted in character translation or format errors in the HTML version. Users should not rely on this HTML document, but are referred to the electronic PDF version and/or the original MMWR paper copy for the official text, figures, and tables. An original paper copy of this issue can be obtained from the Superintendent of Documents, U.S. Government Printing Office (GPO), Washington, DC 20402-9371; telephone: (202) 512-1800. Contact GPO for current prices. **Questions or messages regarding errors in formatting should be addressed to [email protected].Page converted: 12/1/2004 |
|||||||||
This page last reviewed 12/1/2004
|