 |
|
|
|
|
|
|
| ||||||||||
|
|
|
|
|
|
|
||||
| ||||||||||
|
|
|
|
|
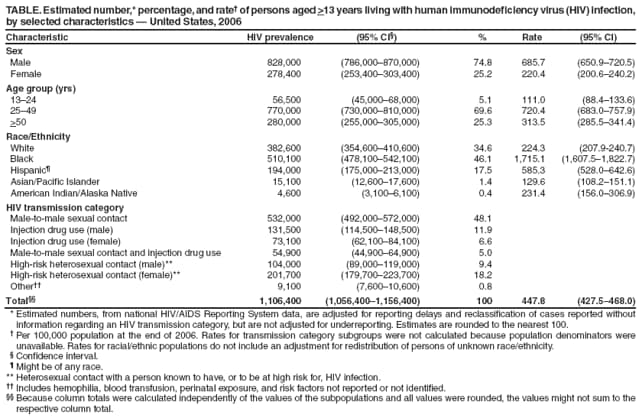
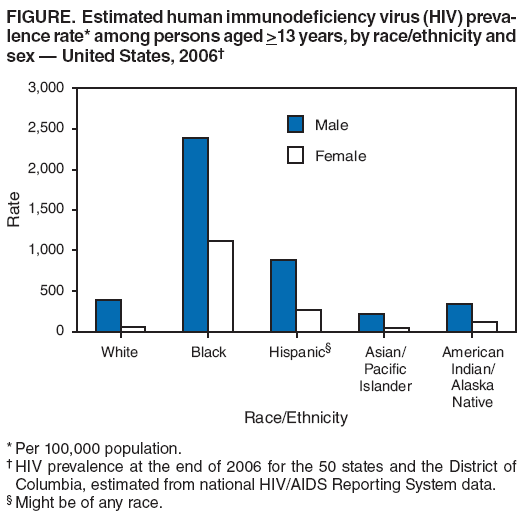
Persons using assistive technology might not be able to fully access information in this file. For assistance, please send e-mail to: [email protected]. Type 508 Accommodation and the title of the report in the subject line of e-mail. HIV Prevalence Estimates -- United States, 2006Accurate and timely data on the number of persons in the United States living with human immunodeficiency virus (HIV) infection (HIV prevalence) are needed to guide planning for disease prevention, program evaluation, and resource allocation. However, overall HIV prevalence cannot be measured directly because a proportion of persons infected with HIV have neither been diagnosed nor reported to local surveillance programs. In addition, national HIV prevalence data are incomplete because local reporting systems for confidential, name-based HIV reporting have been fully implemented only since April 2008. With the advent of highly active antiretroviral therapies that delay the progression of HIV to acquired immunodeficiency syndrome (AIDS), and of AIDS to death (1), and changes in the AIDS case definition to include an immunologic diagnosis (2), earlier back-calculation methods from the 1990s for estimating HIV prevalence based on the number of reported AIDS cases are no longer reliable. With 80% of states reporting name-based HIV diagnoses as of January 2006, an extended back-calculation method now can be used to estimate HIV prevalence more accurately. Based on this method, CDC now estimates that 1.1 million adults and adolescents (prevalence rate: 447.8 per 100,000 population) were living with diagnosed or undiagnosed HIV infection in the United States at the end of 2006. The majority of those living with HIV were nonwhite (65.4%), and nearly half (48.1%) were men who have sex with men (MSM). The HIV prevalence rates for blacks (1,715.1 per 100,000) and Hispanics (585.3 per 100,000) were, respectively, 7.6 and 2.6 times the rate for whites (224.3 per 100,000). An extended back-calculation method has been described in detail and was used recently to calculate the incidence of HIV infection in the United States (3). The method was used in this analysis to estimate HIV prevalence based on the number of HIV diagnoses by calendar year and disease severity (i.e., whether the person received an AIDS diagnosis in the same calendar year as the HIV diagnosis). HIV prevalence at the end of 2006 for the 50 states and District of Columbia was estimated using information from the national HIV/AIDS Reporting System for persons aged >13 years who were diagnosed with HIV during 2006 and reported to CDC by the end of June 2007. Forty states provided data on both HIV and AIDS diagnoses, whereas 10 states (California, Delaware, Hawaii, Illinois, Maryland, Massachusetts, Montana, Oregon, Rhode Island, and Vermont) and the District of Columbia provided data only for AIDS diagnoses. For the areas without name-based HIV data, statistical procedures and AIDS data were used to estimate HIV cases, based on the ratio of HIV to AIDS in states with integrated surveillance systems (4). The number of undiagnosed HIV infections was calculated by subtracting diagnosed AIDS prevalence and diagnosed HIV prevalence from the estimated overall HIV prevalence. Using an established method, data also were adjusted for reporting delays and redistribution of risk factors among persons initially reported without sufficient information to be classified into an HIV transmission category (5). HIV prevalence rates per 100,000 population were calculated for various demographic characteristics; population denominators for rate calculations were based on official postcensus estimates for 2006 (6). Among the estimated number of persons living with HIV at the end of 2006, 46.1% (1,715.1 per 100,000 population) were black, 34.6% (224.3 per 100,000) were white, 17.5% (585.3 per 100,000) were Hispanic, 1.4% (129.6 per 100,000) were Asian/Pacific Islander, and 0.4% (231.4 per 100,000) were American Indian/Alaska Native (Table). Males accounted for 74.8% of prevalent HIV cases (685.7 per 100,000). The greatest percentage of cases was attributed to male-to-male sexual contact, accounting for 48.1% overall (and 64.3% among men). High-risk heterosexual contact, defined as heterosexual contact with a person known to have, or to be at high risk for, HIV infection (e.g., an injection drug user) accounted for 27.6% of prevalent cases overall (12.6% of cases among men and 72.4% of cases among women). Injection drug use (IDU) accounted for 18.5% of total cases (15.9% of cases among men and 26.3% of cases among women). The remainder of cases were attributed to men who reported both male-to-male sexual contact and IDU (5.0%) or whose transmission category was classified as other (0.8%; including hemophilia, blood transfusion, perinatal exposure, and risk factors not reported or not identified). Overall, an estimated 232,700 (21.0%) persons living with HIV infection had not been diagnosed as of the end of 2006. The HIV prevalence rate for black men (2,388.2 per 100,000 population; 95% confidence interval [CI] = 2,197.9 -- 2,578.4) was six times the rate for white men (394.6 per 100,000; CI = 363.3 -- 425.9) (Figure), and the rate for Hispanic men (883.4 per 100,000; CI = 784.9 -- 982.4) was more than twice the rate for white men. The HIV prevalence rate for black women (1,122.4 per 100,000; CI = 1,002.2 -- 1,242.5) was nearly 18 times the rate for white women (62.7 per 100,000; CI = 54.7 -- 70.7), and the rate for Hispanic women (263.0 per 100,000; CI = 231.6 -- 294.4) was more than four times the rate for white women. The HIV prevalence rate for black women was greater than the rate for all other groups, except for black men. Reported by: ML Campsmith, DDS, P Rhodes, PhD, HI Hall, PhD, T Green, PhD, Div of HIV/AIDS Prevention, National Center for HIV/AIDS, Viral Hepatitis, STD, and TB Prevention, CDC. Editorial Note:Reduced mortality resulting from the use of highly active antiretroviral therapies is a major factor contributing to the number of persons in the United States living with HIV disease (1). Additionally, more than 56,000 new HIV infections are estimated to occur annually (3). The estimate of HIV prevalence in this report is similar to an estimate for 2003 (1,039,000 -- 1,185,000) that used the same extended back-calculation method (4). However, because of improvements in national HIV surveillance data since 2003, the two estimates cannot be compared directly. The 2006 estimate is based on a data set that 1) includes HIV diagnoses from 10 states that were not reporting in 2003 and 2) has been refined by an improved ability to identify and remove duplicate HIV case data that reflect reports by more than one state. Using the refined data set, CDC now estimates the HIV prevalence for 2003 to have been 994,000, suggesting that HIV prevalence in the United States increased by approximately 112,000 (11.3%) from 2003 to 2006. Analysis of the refined data also indicated that the percentage of HIV-positive persons who were undiagnosed decreased from approximately 25% in 2003 to 21% in 2006; an estimated 30% of this change resulted from a decrease in the number of undiagnosed persons, and 70% resulted from an increase in the total number of persons living with HIV (CDC, unpublished data, 2008). The burden of HIV infection was disproportionate among populations. Blacks made up 12% of the adult and adolescent population in the United States in 2006 (6), but accounted for 46.1% of persons estimated to be living with HIV. Similarly, nearly half (48.1%) of the persons living with HIV were MSM, and although not precisely known, the percentage of MSM in the general population is estimated to be much lower. Data from CDC's National Survey of Family Growth indicate that, among males aged 15 -- 44 years, 3.7% ever have had anal sex with another male, and the proportion of men who had a male sexual partner in the past 12 months was 2.9% (7). The findings in this report are subject to at least three limitations. First, reported HIV data used in the extended back-calculation method represent only a portion of persons in the United States who were diagnosed with HIV infection; several high-morbidity areas, including California, Illinois, Maryland, and the District of Columbia, did not contribute HIV data. Availability of reported HIV data from these areas will increase accuracy of future prevalence estimates. Second, not all persons who are infected with HIV have been diagnosed and reported to the public health surveillance system, and data must be estimated for undiagnosed persons. Finally, the data have been adjusted statistically to account for delays in reporting new cases and deaths, and cases reported without risk factor information have been redistributed among other transmission categories (5). These adjustments were based on risk redistribution assumptions from the mid-1990s that might no longer be valid, which could result in over- or under-adjustment of the data. Previous studies have indicated that persons generally reduce their sexual risk behaviors (e.g., decrease the number of sex partners and reduce unprotected intercourse through increased condom use) after being diagnosed with HIV (8). Thus, increasing the percentage of HIV-infected persons who are diagnosed and linked with effective care and prevention services has the potential to reduce new HIV infections over time. To help achieve that, CDC has focused resources on increasing testing for HIV, particularly among populations that are disproportionately affected by HIV infection. Recent CDC activities have included publication of revised recommendations for HIV testing in health-care settings (9) and creation of a new program, the Heightened National Response to the HIV/AIDS Crisis in the African American Community (10). In 2007, as part of the President's Domestic HIV Initiative, CDC allocated funds to expand routine HIV testing, primarily among blacks. In addition to testing, expanding the number and reach of effective HIV prevention services for at-risk populations, including blacks, Hispanics, and MSM of all races, can contribute to reducing the disproportionate numbers of infections in these groups. Culturally appropriate opportunities for HIV testing, diagnosis, and access to early treatment and prevention services to reduce further HIV transmission are key to reducing new infections and ultimately decreasing HIV prevalence in the United States. References
Table  Return to top. Figure  Return to top.
All MMWR HTML versions of articles are electronic conversions from typeset documents. This conversion might result in character translation or format errors in the HTML version. Users are referred to the electronic PDF version (http://www.cdc.gov/mmwr) and/or the original MMWR paper copy for printable versions of official text, figures, and tables. An original paper copy of this issue can be obtained from the Superintendent of Documents, U.S. Government Printing Office (GPO), Washington, DC 20402-9371; telephone: (202) 512-1800. Contact GPO for current prices. **Questions or messages regarding errors in formatting should be addressed to [email protected].Date last reviewed: 10/1/2008 |
|||||||||
|