Persons using assistive technology might not be able to fully access information in this file. For assistance, please send e-mail to: [email protected]. Type 508 Accommodation and the title of the report in the subject line of e-mail.
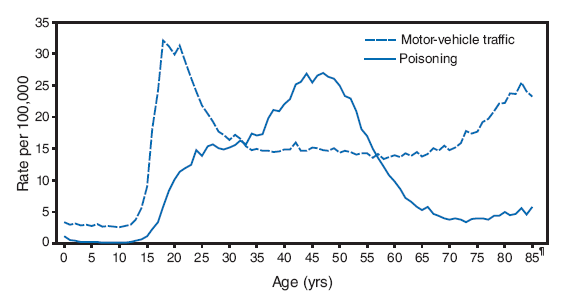
QuickStats: Motor-Vehicle Traffic* and Poisoning† Death Rates,§ by Age --- United States, 2005--2006

* Motor-vehicle traffic deaths include pedestrians, pedal cyclists, or occupants, and involve any type of motor vehicle on public roads.
† Poisoning deaths include those resulting from drug overdose or other misuse of drugs, and those associated with solid or liquid biologic substances, gases or vapors, or other substances.
§ Deaths from injuries, per 100,000 population. Injuries are of any manner, including unintentional, suicide, homicide, undetermined intent, legal intervention, and operations of war.
¶ Aggregate death rate for persons aged ≥85 years.
Motor-vehicle traffic and poisoning were the leading causes of injury deaths in the United States during 2005--2006. Motor-vehicle traffic death rates were higher than poisoning death rates among persons aged ≤31 years and those aged ≥58 years. Poisoning death rates were higher than motor-vehicle traffic death rates among adults aged 34--56 years. During 2005--2006, 92% of poisoning deaths involved drugs.
SOURCE: National Vital Statistics System, mortality data, available at http://www.cdc.gov/nchs/deaths.htm.
Alternative Text: The figure above shows motor-vehicle traffic and poisoning death rates, by age in the United States from 2005 through 2006. Motor-vehicle traffic and poisoning were the leading causes of injury deaths in the United States during 2005-2006. Motor-vehicle traffic death rates were higher than poisoning death rates among persons aged <31 years and those aged >58 years. Poisoning death rates were higher than motor-vehicle traffic death rates among adults aged 34-56 years. During 2005-2006, 92% of poisoning deaths involved drugs.


