Skip directly to search Skip directly to A to Z list Skip directly to site content
CDC Home

Persons using assistive technology might not be able to fully access information in this file. For assistance, please send e-mail to: [email protected]. Type 508 Accommodation and the title of the report in the subject line of e-mail.

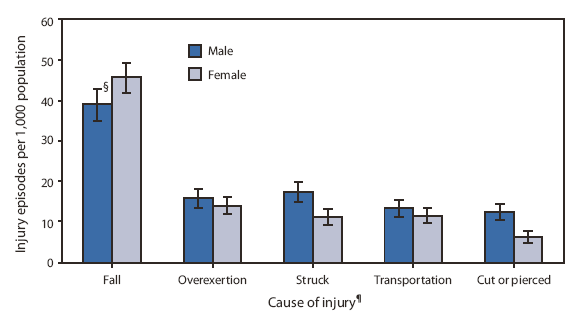
QuickStats: Annual Rate* of Injury Episodes for Leading Causes of Injury, by Sex --- National Health Interview Survey, United States, 2004--2007

The figure shows the rate of injury episodes for leading external causes, by sex in the United States during 2004-2007. Falls were the leading cause of injury, accounting for nearly 40% of all injuries and more than twice as many injuries as any other cause. The injury rate for falls was 17% higher among females than males. In contrast, the injury rate for being struck was 35% lower among females than males, and the injury rate for being cut or pierced was 50% lower among females than males.

* Rates are average annual estimates and are age adjusted using the 2000 U.S. standard population and the following age groups: <15 years, 15--24 years, 25--44 years, 45--64 years, 65--74 years, and ≥75 years.

Episodes of physical damage to the body from external causes resulting from traumatic events, which can include intentional or unintentional injuries. Estimates are based on responses to a series of questions asked during a household interview of a sample of the civilian, noninstitutionalized U.S. population and are for nonfatal, medically attended injuries during the 5 weeks preceding the interview.

§ 95% confidence interval.

"Overexertion" denotes excessive physical exercise or strenuous movements in recreational or other activities; "struck" denotes being struck by or against an object or person; "transportation" denotes trauma involving motor vehicles, bicycles, motorcycles, pedestrians, trains, boats, and airplanes; and "cut or pierced" denotes being cut or pierced by instruments or objects.

During 2004--2007, falls were the leading cause of injury, accounting for nearly 40% of all injuries and more than twice as many injuries as any other cause. Falls were the leading cause for both males and females, but the age-adjusted injury rate for falls was 17% higher among females than males. In contrast, the age-adjusted injury rate for being struck was 35% lower among females than males, and the injury rate for being cut or pierced was 50% lower among females than males.

SOURCE: Chen LH, Warner M, Fingerhut L, Makuc D. Injury episodes and circumstances: National Health Interview Survey, 1997--2007. Vital Health Stat 2009;10(241). Available at http://www.cdc.gov/nchs/data/series/sr_10/sr10_241.pdf.

Alternative Text: The figure above shows the rate of injury episodes for leading external causes, by sex in the United States during 2004-2007. Falls were the leading cause of injury, accounting for nearly 40% of all injuries and more than twice as many injuries as any other cause. The injury rate for falls was 17% higher among females than males. In contrast, the injury rate for being struck was 35% lower among females than males, and the injury rate for being cut or pierced was 50% lower among females than males.


Use of trade names and commercial sources is for identification only and does not imply endorsement by the U.S. Department of Health and Human Services.

References to non-CDC sites on the Internet are provided as a service to MMWR readers and do not constitute or imply endorsement of these organizations or their programs by CDC or the U.S. Department of Health and Human Services. CDC is not responsible for the content of pages found at these sites. URL addresses listed in MMWR were current as of the date of publication.


All MMWR HTML versions of articles are electronic conversions from typeset documents. This conversion might result in character translation or format errors in the HTML version. Users are referred to the electronic PDF version (http://www.cdc.gov/mmwr) and/or the original MMWR paper copy for printable versions of official text, figures, and tables. An original paper copy of this issue can be obtained from the Superintendent of Documents, U.S. Government Printing Office (GPO), Washington, DC 20402-9371; telephone: (202) 512-1800. Contact GPO for current prices.

**Questions or messages regarding errors in formatting should be addressed to [email protected].

 
USA.gov: The U.S. Government's Official Web PortalDepartment of Health and Human Services
Centers for Disease Control and Prevention   1600 Clifton Road Atlanta, GA 30329-4027, USA
800-CDC-INFO (800-232-4636) TTY: (888) 232-6348 - Contact CDC–INFO
A-Z Index
  1. A
  2. B
  3. C
  4. D
  5. E
  6. F
  7. G
  8. H
  9. I
  10. J
  11. K
  12. L
  13. M
  14. N
  15. O
  16. P
  17. Q
  18. R
  19. S
  20. T
  21. U
  22. V
  23. W
  24. X
  25. Y
  26. Z
  27. #