Skip directly to search Skip directly to A to Z list Skip directly to site content
CDC Home

Persons using assistive technology might not be able to fully access information in this file. For assistance, please send e-mail to: [email protected]. Type 508 Accommodation and the title of the report in the subject line of e-mail.

Vital Signs: Current Cigarette Smoking Among Adults Aged ≥18 Years --- United States, 2009

On September 7, this report was posted as an MMWR Early Release on the MMWR website (http://www.cdc.gov/mmwr).

ABSTRACT

Background: Cigarette smoking continues to be the leading cause of preventable morbidity and mortality in the United States, causing approximately 443,000 premature deaths annually.

Methods: The 2009 National Health Interview Survey and the 2009 Behavioral Risk Factor Surveillance System were used to estimate national and state adult smoking prevalence, respectively. Cigarette smokers were defined as adults aged ≥18 years who reported having smoked ≥100 cigarettes in their lifetime and now smoke every day or some days.

Results: In 2009, 20.6% of U.S. adults aged ≥18 years were current cigarette smokers. Men (23.5%) were more likely than women (17.9%) to be current smokers. The prevalence of smoking was 31.1% among persons below the federal poverty level. For adults aged ≥25 years, the prevalence of smoking was 28.5% among persons with less than a high school diploma, compared with 5.6% among those with a graduate degree. Regional differences were observed, with the West having the lowest prevalence (16.4%) and higher prevalences being observed in the South (21.8%) and Midwest (23.1%). From 2005 to 2009, the proportion of U.S. adults who were current cigarette smokers did not change (20.9% in 2005 and 20.6% in 2009).

Conclusions: Previous declines in smoking prevalence in the United States have stalled during the past 5 years; the burden of cigarette smoking continues to be high, especially in persons living below the federal poverty level and with low educational attainment. Sustained, adequately funded, comprehensive tobacco control programs could reduce adult smoking.

Implications for Public Health Practice: To further reduce disease and death from cigarette smoking, declines in cigarette smoking among adults must accelerate. The Patient Protection and Affordable Care Act is expected to expand access to evidence-based smoking-cessation services and treatments; this likely will result in additional use of these services and reductions of current smoking and its adverse effects among U.S. adults. Population-based prevention strategies such as tobacco taxes, media campaigns, and smoke-free policies, in concert with clinical cessation interventions, can help adults quit and prevent the uptake of tobacco use, furthering the reduction in the current prevalence of tobacco use in the United States across age groups.

Cigarette smoking continues to be the leading cause of preventable morbidity and mortality in the United States. The negative health consequences of cigarette smoking have been well-documented and include cardiovascular disease, multiple cancers, pulmonary disease, adverse reproductive outcomes, and exacerbation of other chronic health conditions (1). Cigarette smoking causes approximately 443,000 premature deaths in the United States annually and $193 billion in direct health-care expenditures and productivity losses because of premature mortality each year.*

Despite significant declines during the past 30 years, cigarette smoking in the United States continues to be widespread; in 2008, one in five U.S. adults (20.6%) were current smokers (2). Year-to-year decreases in smoking prevalence have been observed only sporadically in recent years. For example, a slight decrease occurred from 2006 to 2007 but not from 2007 to 2008 (2). Monitoring tobacco use is essential in the effort to curb the epidemic of tobacco use. To assess progress toward the Healthy People 2010 objective of reducing the prevalence of cigarette smoking among adults to ≤12% (objective 27-1a),§ this report provides the most recent national estimates of smoking prevalence among adults aged ≥18 years, based on data from the 2009 National Health Interview Survey (NHIS), and provides state-level estimates based on data from the 2009 Behavioral Risk Factor Surveillance System (BRFSS) survey.

Methods

The 2009 NHIS adult core questionnaire collects national health information on illness and disability. The questionnaire was administered by in-person interview and included a random probability sample of 27,731 noninstitutionalized civilian adults aged ≥18 years; the overall response rate was 65.4%. Of the 27,731, a total of 128 were excluded because of unknown smoking status; thus, the final sample size used in the analyses was 27,603. The BRFSS survey is a state-based, random-digit--dialed telephone survey of the noninstitutionalized civilian adult population and collects information on preventive health practices, health-risk behaviors, and health-care access in the United States. The core questionnaire includes questions on current cigarette smoking; the Council of American Survey and Research Organizations (CASRO) median response rate was 52.5% (from 38.0% in Oregon to 66.9% in Nebraska), and the median cooperation rate was 75.0% (55.5% in California to 88.0% in Kentucky).

Smoking status was defined identically for both surveillance systems by using two questions, "Have you smoked at least 100 cigarettes in your entire life?" and "Do you now smoke cigarettes every day, some days, or not at all?" Respondents who had smoked at least 100 cigarettes during their lifetime and, at the time of interview, reported smoking every day or some days were classified as current smokers. Smoking status was examined by race/ethnicity, age group, education (among persons aged ≥25 years), poverty status, and region (overall and by sex). Starting in 2007, income-related follow-up questions were added to NHIS to reduce the number of responses with unknown values.** For this report, poverty status was defined using 2008 poverty thresholds published by the U.S. Census Bureau in 2009; family income was reported by the family respondent, who might or might not have been the same as the sample adult respondent from whom smoking information was collected.

Data from the 2009 NHIS were adjusted for nonresponse and weighted to provide national estimates of cigarette smoking prevalence; 95% confidence intervals were calculated to account for the survey's multistage probability sample design. Data from the 2009 BRFSS were weighted to adjust for differences in probability of selection and nonresponse, as well as noncoverage (e.g., households lacking landlines), and these sampling weights were used to calculate all estimates. Using NHIS data, the Wald test from logistic regression analysis was used to analyze temporal changes in current smoking prevalence during 2005--2009, overall and by region. For this 5-year trend analysis, results were adjusted for sex, age, and race/ethnicity; a p-value of <0.05 was used to determine statistical significance. NHIS results with relative standard error of ≥30% are not reported.

Results

In 2009, an estimated 20.6% (46.6 million) of U.S. adults were current cigarette smokers; of these, 78.1% (36.4 million) smoked every day, and 21.9% (10.2 million) smoked on some days. Prevalence of current smoking was higher among men (23.5%) than women (17.9%) (Table). Among racial/ethnic groups, Asians had the lowest prevalence (12.0%), and Hispanics had a lower prevalence of smoking (14.5%) than non-Hispanic blacks (21.3%) and non-Hispanic whites (22.1%). Adults reporting multiple races had the highest prevalence (29.5%), followed by American Indians/Alaska Natives (23.2%).

Variations in smoking prevalence in 2009 were observed by education level (Table). Smoking prevalence was highest among adults who had obtained a General Education Development certificate (GED) (49.1%) and generally declined with increasing education, being lowest among adults with a graduate degree (5.6%). The prevalence of current smoking was higher among adults living below the federal poverty level (31.1%) than among those at or above this level (19.4%). Smoking prevalence did not vary significantly for adults aged 18--24 years (21.8%), 25--44 years (24.0%), and 45--64 years (21.9%); however, it was lowest for adults aged ≥65 years (9.5%). Regionally, smoking prevalence was higher in the Midwest (23.1%) and South (21.8%), and lowest prevalence for adult current smoking was observed for the West (16.4%).

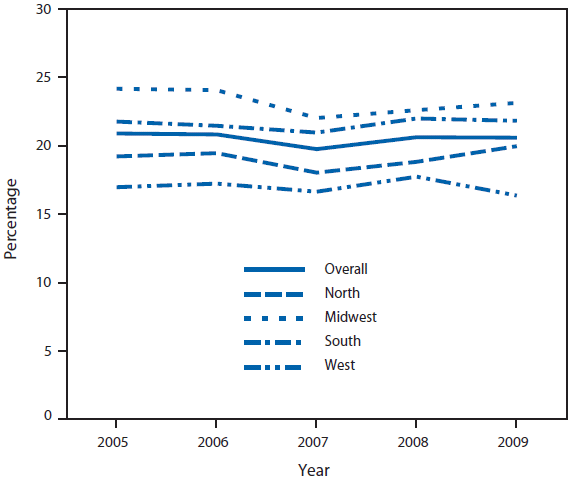
During 2005--2009, the proportion of U.S. adults who were current cigarette smokers was 20.9% in 2005†† and 20.6% in 2009, with no significant difference (Figure 1). No significant changes in current smoking prevalence for U.S. adults were observed during the 5-year period overall and for each of the four regions: Northeast, Midwest, South, or West (p≥0.05).

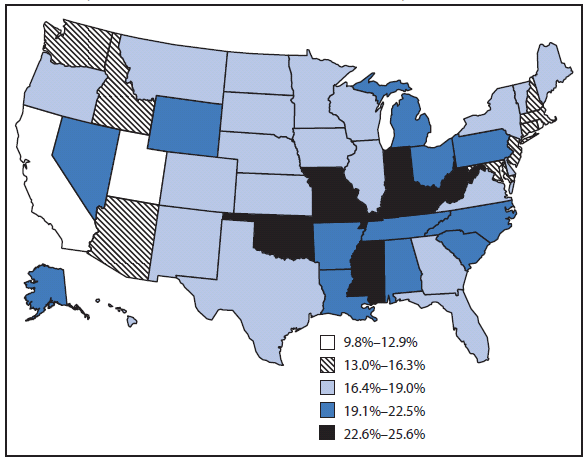
By state, the prevalence of current smoking ranged from 9.8% (Utah) to 25.6% (Kentucky and West Virginia) (Figure 2). States with the highest prevalence of adult current smoking were clustered in the Midwest and Southeast regions.

Conclusions and Comment

The results of these analyses indicate that the national estimates for the prevalence of current cigarette smoking among adults aged ≥18 years did not decline from 2008 (20.6%) (2) to 2009, and during the past 5 years (2005--2009) virtually no change has been observed, even by region. In 2009, certain population subgroups (e.g., Hispanic and Asian women, persons with higher levels of education, and older adults) continue to meet the Healthy People 2010 target of ≤12% prevalence of smoking. Although smoking prevalence was found to be lowest among Asian and Hispanic women, the findings in this report cannot assess specific Asian and Hispanic subgroups. In a previous report, variations in smoking prevalence were observed within specific Asian and Hispanic subgroups and between the sexes within these subgroups, suggesting that overall prevalence for Asians and Hispanics do not accurately represent the wide variability across subgroups (3).

Differences in understanding the health hazards of smoking and receptivity to antismoking messages might be related to the prevalence variations observed by education level (4). For example, persons with higher levels of education might have a better understanding of the health hazards of smoking and might be more receptive to health messaging about the dangers of smoking (4). Nonetheless, most population subgroups, particularly those with low education and income levels, will not meet the Healthy People 2010 target.

Differences also were noted by state and region. In 2009, the lowest prevalence was observed in the West, with lowest prevalence in Utah, followed by California. California traditionally has been cited for its success in tobacco control because of its long-running comprehensive tobacco control program (5). California's adult smoking prevalence declined approximately 40% during 1998--2006, and consequently lung cancer incidence in California has been declining four times faster than in the rest of the nation (5). Similarly, Maine, New York, and Washington have seen 45%--60% reductions in youth smoking with sustained comprehensive statewide programs (5).

Youth smoking is an important indicator to monitor because most adult established smokers (>80%) begin before the age of 18 years.§§ In 2009, one in five U.S. high school students (19.5%) reported smoking cigarettes in the preceding 30 days (6). Moreover, declines in current smoking among high school students have slowed, with an 11% decline from 21.9% in 2003 to 19.5% in 2009 compared with a 40% decline observed from 1997 (36.4%) to 2003 (21.9%) (7). The slowing in the decline observed for youth cigarette smoking indicates that cigarette smoking among adults and the associated morbidity and mortality will continue to be important public health issues for the foreseeable future.

The findings in this report are subject to at least six limitations. First, the estimates of cigarette smoking were self-reported and were not validated by biochemical tests. However, other studies using levels of serum cotinine (a breakdown product of nicotine), yield similar prevalence estimates as those obtained from self-reports (8). Second, questionnaires are administered only in English and Spanish; therefore, smoking prevalence for certain racial/ethnic populations might be overestimated or underestimated if English and Spanish are not the primary languages spoken. Third, race/ethnicity was not adjusted for socioeconomic status. Fourth, because NHIS and BRFSS do not include institutionalized populations and persons in the military, the results are not generalizable to these groups. Fifth, BRFSS does not currently include adults without telephone service (1.9%) or with wireless-only service (13.6%).¶¶ Because adults with wireless-only service are more likely to smoke cigarettes than the rest of the U.S. population and wireless-only service varies by state, state smoking prevalence might be underestimated.*** Finally, small samples sizes for certain population groups resulted in some imprecise estimates. This might explain why the 2009 prevalence estimate for American Indian/Alaska Native women is lower than prevalence estimates from recent years.

The Healthy People 2010 objective of reducing the overall prevalence of cigarette smoking among U.S. adults to ≤12% (objective 27-1a) will not be met in 2010. However, for some subpopulations and states, this goal has been reached, demonstrating that the national target is achievable. To meet this goal for the entire population in the future, evidence-based strategies focused on populations such as persons with lower education are needed (5). Effective strategies including price increases, comprehensive smoke-free policies, and media campaigns to counter pro-tobacco industry influences need to be implemented aggressively in coordination with providing access to affordable and effective cessation treatments and services (5,9). If each state sustained comprehensive tobacco control programs for 5 years with CDC-recommended levels of funding, an estimated 5 million fewer persons in the country would smoke, resulting in prevention of premature tobacco-related deaths (5).

As this analysis shows, some populations have a higher prevalence of cigarette use; thus, a focus on reducing tobacco-related disparities also is necessary (5). The Patient Protection and Affordable Care Act††† is expected to expand access to evidence-based smoking-cessation services and treatments. Given the decline in smoking prevalence that was observed after the implementation of a mandated tobacco cessation coverage for the Massachusetts Medicaid program (10), expanded access to cessation services and treatments might result in reductions in current smoking and its adverse effects among U.S. adults. For this to occur, health professionals need to better identify, educate, and offer appropriate cessation services to persons who use tobacco.

The enactment of the 2009 Family Smoking Prevention and Tobacco Control Act§§§ has provided new opportunities for reductions in tobacco use (7,9). The Act gives the Food and Drug Administration authority to regulate the manufacturing, marketing, and distribution of tobacco products. Full implementation of comprehensive tobacco control policies and programs at CDC-recommended levels of funding (5) would resume progress toward reducing the prevalence of smoking in the population.

Reported by

SR Dube, PhD, A McClave, MPH, C James, MSPH, R Caraballo, PhD, R Kaufmann, PhD, T Pechacek, PhD, Office on Smoking and Health, National Center for Chronic Disease Prevention and Health Promotion, CDC.

Acknowledgments

This report is based, in part, on contributions by P Barnes, MA, and C Schoenborn, MPH, National Center for Health Statistics, CDC.

References

  1. US Department of Health and Human Services. The health consequences of smoking: a report of the Surgeon General. Atlanta, GA: US Department of Health and Human Services, CDC; 2004. Available at http://www.cdc.gov/tobacco/data_statistics/sgr/sgr_2004/index.htm.
  2. CDC. Cigarette smoking among adults and trends in smoking cessation---United States, 2008. MMWR 2009;58:1227--32.
  3. Caraballo RS, Yee SL, Gfroerer J, Mizra SA. Adult tobacco use among racial and ethnic groups living in the United States, 2002--2005. Prev Chronic Dis 2008;5:1--9.
  4. Siahpush M, McNeill A, Hammond D, Fong GT. Socioeconomic and country variations in knowledge of health risks of tobacco smoking and toxic constituents of smoke: results from the 2002 International Tobacco Control (ITC) Four Country Survey. Tob Control 2006;15(Suppl III):65--70.
  5. CDC. Best practices for comprehensive tobacco control programs---2007. Atlanta, GA: US Department of Health and Human Services, CDC; 2007. Available at http://www.cdc.gov/tobacco/tobacco_control_programs/stateandcommunity/best_practices.
  6. CDC. Youth Risk Behavior Surveillance---United States, 2009. MMWR 2010;59(No. SS-5).
  7. CDC. Cigarette use among high school students---United States, 1991--2009 MMWR 2010;59:797--801.
  8. Caraballo RS, Giovino GA, Pechacek TF, Mowery PD. Factors associated with discrepancies between self-reports on cigarette smoking and measured serum cotinine levels among person aged 17 years or older: third National Health and Nutrition Examination Survey, 1988--1994. Am J Epidemiol 2001;153:807--14.
  9. CDC. CDC Grand Rounds: current opportunities in tobacco control. MMWR 2010;59:487--92.
  10. Land T, Warner D, Paskowsky M, et al. Medicaid coverage for tobacco dependence treatments in Massachusetts and associated decreases in smoking prevalence. PLoS One 2010;5:e9770.

* Additional information available at http://www.cdc.gov/tobacco/data_statistics/fact_sheets/fast_facts/index.htm.

Additional information available at http://www.who.int/tobacco/mpower/mpower_report_full_2008.pdf.

§ Additional information available at http://www.healthypeople.gov/document/html/objectives/27-01.htm.

Based on Council of American Survey and Research Organizations (CASRO) definitions. The response rate is the percentage of persons who completed interviews among all eligible persons, including those who were not successfully contacted. The cooperation rate is the percentage of persons who completed interviews among all eligible persons who were contacted.

** Additional information available at ftp://ftp.cdc.gov/pub/health_statistics/nchs/dataset_documentation/nhis/1997/srvydesc.pdf.

†† Additional information available at http://www.cdc.gov/mmwr/preview/mmwrhtml/mm5542a1.htm.

§§ Additional information available at http://www.oas.samhsa.gov/nsduh/2k8nsduh/2k8results.cfm.

¶¶ Additional information available at http://www.cdc.gov/nchs/data/nhsr/nhsr014.pdf.

*** Additional information available at http://www.cdc.gov/nchs/nhis.htm.

††† Additional information available at http://www.dol.gov/ebsa/healthreform.

§§§ Family Smoking Prevention and Tobacco Control Act, Pub. L. 111-31, 123 Stat1776 (2009). Additional information available at http://www.gpo.gov/fdsys/pkg/PLAW-111publ31/content-detail.html.


Key Points

  • Smoking causes approximately 443,000 premature deaths, accounts for up to 30% of cancer deaths, and is the single most preventable cause of disease and death in the United States.

  • Despite the adverse health effects of smoking cigarettes, one in five U.S. adults (46.6 million men and women) currently smoke.

  • The prevalence of adult smoking is not decreasing. Effective population-based strategies to encourage cessation (e.g., tobacco taxes, smoke-free policies, and media campaigns) are essential to accelerate the reduction in tobacco use among adults in the United States and prevent smoking initiation in young persons.

  • Effective cessation methods should be made available to increase success rates when tobacco users make quit attempts.

  • Additional information is available at http://www.cdc.gov/tobacco and http://www.cdc.gov/vitalsigns.


TABLE. Percentage of persons aged ≥18 years who were current cigarette smokers,* by selected characteristics --- National Health Interview Survey, United States, 2009


Total
(N = 27,603)

Men
(n = 12,193)

Women
(n = 15,410)

Characteristic

%

(95% CI)

%

(95% CI)

%

(95% CI)

Age group (yrs)


18--24

21.8

(19.4--24.2)

28.0

(24.5--31.5)

15.6

(12.9--18.3)

25--44

24.0

(22.8--25.1)

26.5

(24.7--28.2)

21.5

(20.1--22.9)

45--64

21.9

(20.7--23.2)

24.5

(22.8--26.2)

19.5

(17.9--21.1)

≥65

9.5

(8.5--10.5)

9.5

(8.1--10.9)

9.5

(8.2--10.8)

Race/Ethnicity§


White, non-Hispanic

22.1

(21.2--23.1)

24.5

(23.2--25.9)

19.8

(18.8--20.8)

Black, non-Hispanic

21.3

(19.6--22.9)

23.9

(21.5--26.2)

19.2

(17.1--21.3)

Hispanic

14.5

(13.2--15.8)

19.0

(16.9--21.1)

9.8

(8.5--11.0)

American Indian/Alaska Native

23.2

(12.9--33.5)

29.7

(15.4--44.0)

---

---

Asian, non-Hispanic**

12.0

(10.0--14.0)

16.9

(14.0--19.9)

7.5

(4.8--10.3)

Multiple race, non-Hispanic

29.5

(22.9--36.1)

33.7

(24.4--43.0)

24.8

(16.6--33.0)

Education††


0--12 yrs (no diploma)

26.4

(24.5--28.3)

30.5

(27.6--33.5)

22.2

(19.9--24.5)

≤8 yrs

17.1

(14.5--19.6)

22.2

(18.0--26.4)

11.9

(9.2--14.7)

9--11 yrs

33.6

(30.7--36.5)

36.5

(32.2--40.9)

30.5

(26.6--34.4)

12 yrs (no diploma)

28.5

(23.2--33.9)

34.1

(26.0--42.1)

23.3

(17.0--29.6)

GED§§

49.1

(44.5--53.8)

53.2

(46.6--59.8)

44.7

(38.2--51.2)

High school graduate

25.1

(23.6--26.5)

29.0

(26.9--31.2)

21.5

(19.8--23.3)

Some college (no degree)

23.3

(21.7--24.9)

26.1

(23.4--28.8)

21.0

(19.0--22.9)

Associate degree

19.7

(17.9--21.5)

20.6

(17.5--23.6)

19.1

(16.5--21.6)

Undergraduate degree

11.1

(10.0--12.3)

12.4

(10.7--14.2)

9.9

(8.3--11.4)

Graduate degree

5.6

(4.6--6.6)

4.9

(3.6--6.3)

6.3

(4.7--7.9)

Poverty status¶¶


At or above poverty level

19.4

(18.6--20.2)

22.2

(21.1--23.3)

16.7

(15.7--17.6)

Below poverty level

31.1

(29.1--32.9)

34.2

(31.0--37.5)

28.7

(26.5--30.9)

Unspecified

17.3

(15.3--19.3)

22.3

(18.6--26.1)

13.2

(11.0--15.4)

Region***


Northeast

20.0

(18.0--22.0)

23.4

(20.5--26.3)

16.9

(14.8--19.0)

New England

19.4

(15.2--23.6)

21.5

(14.4--28.6)

17.5

(14.6--20.4)

Mid-Atlantic

20.2

(18.0--22.4)

24.1

(21.1--27.1)

16.7

(14.1--19.3)

Midwest

23.1

(21.6--24.7)

25.7

(23.3--28.1)

20.8

(19.2--22.3)

East North Central

23.8

(22.1--25.5)

26.7

(23.8--29.6)

21.1

(19.5--22.6)

West North Central

21.8

(18.8--24.8)

23.6

(19.7--27.5)

20.1

(16.5--23.7)

South

21.8

(20.7--22.9)

24.5

(22.8--26.2)

19.3

(18.1--20.5)

South Atlantic

20.1

(18.7--21.5)

22.3

(20.1--24.5)

18.0

(16.4--19.6)

East South Central

25.8

(22.7--28.9)

30.1

(25.0--35.2)

22.3

(20.0--24.6)

West South Central

22.5

(20.5--24.5)

25.5

(22.6--28.4)

19.8

(17.4--22.2)

West

16.4

(14.9--17.9)

19.5

(17.6--21.4)

13.3

(11.3--15.2)

Mountain

18.8

(16.0--21.6)

21.7

(18.1--25.3)

16.0

(13.0--19.0)

Pacific

15.3

(13.6--17.0)

18.6

(16.4--20.8)

12.1

(9.7--14.5)

Total

20.6

(19.9--21.3)

23.5

(22.4--24.5)

17.9

(17.1--18.7)

* Persons who reported smoking at least 100 cigarettes during their lifetimes and who, at the time of interview, reported smoking every day or some days. Excludes 128 respondents whose smoking status was unknown.

95% confidence interval.

§ Excludes 53 respondents of unknown race.

Data not reported because of unstable percentages; relative standard error ≥30%.

** Does not include Native Hawaiians or Other Pacific Islanders.

†† Among persons aged ≥25 years. Excludes 137 persons whose educational level was unknown.

§§ General Educational Development certificate.

¶¶ Family income is reported by the family respondent who might or might not be the same as the sample adult respondent from whom smoking information is collected; 2009 estimates are based on reported family income and 2008 poverty thresholds published by the U.S. Census Bureau.

*** New England: Maine, New Hampshire, Vermont, Massachusetts, Rhode Island, and Connecticut. Mid-Atlantic: New York, Pennsylvania, and New Jersey. East North Central: Wisconsin, Michigan, Illinois, Indiana, and Ohio. West North Central: Missouri, North Dakota, South Dakota, Nebraska, Kansas, Minnesota, and Iowa. South Atlantic: Delaware, Maryland, District of Columbia, Virginia, West Virginia, North Carolina, South Carolina, Georgia, and Florida. East South Central: Kentucky, Tennessee, Mississippi, and Alabama. West South Central: Oklahoma, Texas, Arkansas, and Louisiana. Mountain: Idaho, Montana, Wyoming, Nevada, Utah, Colorado, Arizona, and New Mexico. Pacific: Alaska, Washington, Oregon, California, and Hawaii.


FIGURE 1. Percentage of adults aged ≥18 years who were current smokers,* by geographic region --- National Health Interview Survey, United States, 2005--2009

The figure shows the percentage of adults aged ≥18 years who were current smokers, by geographic region in the United States, during 2005-2009, based on data from the National Health Interview Survey. During this period, the proportion of U.S. adults who were current cigarette smokers was 20.9% in 2005 and 20.6% in 2009, with no significant difference.

* Persons who reported smoking at least 100 cigarettes during their lifetimes and who, at the time of the survey, reported smoking every day or some days.

Alternate Text: The figure above shows the percentage of adults aged ≥18 years who were current smokers, by geographic region in the United States, during 2005-2009, based on data from the National Health Interview Survey. During this period, the proportion of U.S. adults who were current cigarette smokers was 20.9% in 2005 and 20.6% in 2009, with no significant difference.


FIGURE 2. Percentage of persons aged ≥18 years who were current cigarette smokers,* by state --- Behavioral Risk Factor Surveillance System, United States, 2009

The figure shows the percentage of persons aged ≥18 years, by state, who were current cigarette smokers in the United States in 2009, based on data from the Behavioral Risk Factor Surveillance System. The prevalence of current smoking ranged from 9.8% (Utah) to 25.6% (Kentucky and West Virginia). States with the highest prevalence of adult current smoking were clustered in the Midwest and Southeast regions.

* Persons who reported smoking at least 100 cigarettes during their lifetimes and who, at the time of the survey, reported smoking every day or some days.

Alternate Text: The figure above shows the percentage of persons aged ≥18 years, by state, who were current cigarette smokers in the United States in 2009, based on data from the Behavioral Risk Factor Surveillance System. The prevalence of current smoking ranged from 9.8% (Utah) to 25.6% (Kentucky and West Virginia). States with the highest prevalence of adult current smoking were clustered in the Midwest and Southeast regions.


Use of trade names and commercial sources is for identification only and does not imply endorsement by the U.S. Department of Health and Human Services.

References to non-CDC sites on the Internet are provided as a service to MMWR readers and do not constitute or imply endorsement of these organizations or their programs by CDC or the U.S. Department of Health and Human Services. CDC is not responsible for the content of pages found at these sites. URL addresses listed in MMWR were current as of the date of publication.


All MMWR HTML versions of articles are electronic conversions from typeset documents. This conversion might result in character translation or format errors in the HTML version. Users are referred to the electronic PDF version (http://www.cdc.gov/mmwr) and/or the original MMWR paper copy for printable versions of official text, figures, and tables. An original paper copy of this issue can be obtained from the Superintendent of Documents, U.S. Government Printing Office (GPO), Washington, DC 20402-9371; telephone: (202) 512-1800. Contact GPO for current prices.

**Questions or messages regarding errors in formatting should be addressed to [email protected].

 
USA.gov: The U.S. Government's Official Web PortalDepartment of Health and Human Services
Centers for Disease Control and Prevention   1600 Clifton Road Atlanta, GA 30329-4027, USA
800-CDC-INFO (800-232-4636) TTY: (888) 232-6348 - Contact CDC–INFO
A-Z Index
  1. A
  2. B
  3. C
  4. D
  5. E
  6. F
  7. G
  8. H
  9. I
  10. J
  11. K
  12. L
  13. M
  14. N
  15. O
  16. P
  17. Q
  18. R
  19. S
  20. T
  21. U
  22. V
  23. W
  24. X
  25. Y
  26. Z
  27. #