Skip directly to search Skip directly to A to Z list Skip directly to site content
CDC Home

Persons using assistive technology might not be able to fully access information in this file. For assistance, please send e-mail to: [email protected]. Type 508 Accommodation and the title of the report in the subject line of e-mail.

Vital Signs: Avoidable Deaths from Heart Disease, Stroke, and Hypertensive Disease — United States, 2001–2010

On September 3, 2013, this report was posted as an MMWR Early Release on the MMWR website (http://www.cdc.gov/mmwr).

Abstract

Background: Deaths attributed to lack of preventive health care or timely and effective medical care can be considered avoidable. In this report, avoidable causes of death are either preventable, as in preventing cardiovascular events by addressing risk factors, or treatable, as in treating conditions once they have occurred. Although various definitions for avoidable deaths exist, studies have consistently demonstrated high rates in the United States. Cardiovascular disease is the leading cause of U.S. deaths (approximately 800,000 per year) and many of them (e.g., heart disease, stroke, and hypertensive deaths among persons aged <75 years) are potentially avoidable.

Methods: National Vital Statistics System mortality data for the period 2001–2010 were analyzed. Avoidable deaths were defined as those resulting from an underlying cause of heart disease (ischemic or chronic rheumatic), stroke, or hypertensive disease in decedents aged <75 years. Rates and trends by age, sex, race/ethnicity, and place were calculated.

Results: In 2010, an estimated 200,070 avoidable deaths from heart disease, stroke, and hypertensive disease occurred in the United States, 56% of which occurred among persons aged <65 years. The overall age-standardized death rate was 60.7 per 100,000. Rates were highest in the 65–74 years age group, among males, among non-Hispanic blacks, and in the South. During 2001–2010, the overall rate declined 29%, and rates of decline varied by age.

Conclusions: Nearly one fourth of all cardiovascular disease deaths are avoidable. These deaths disproportionately occurred among non-Hispanic blacks and residents of the South. Persons aged <65 years had lower rates than those aged 65–74 years but still accounted for a considerable share of avoidable deaths and demonstrated less improvement.

Implications for Public Health Practice: National, state, and local initiatives aimed at improving health-care systems and supporting healthy behaviors are essential to reducing avoidable heart disease, stroke, and hypertensive disease deaths. Strategies include promoting the ABCS (aspirin when appropriate, blood pressure control, cholesterol management, and smoking cessation), reducing sodium consumption, and creating healthy environments.

Introduction

In the 1970s, a method for measuring the quality of medical care through identifying "untimely and unnecessary" deaths was proposed (1). This concept has since been expanded to include deaths attributed to lack of preventive health care (i.e., preventing cardiovascular events by addressing risk factors) or timely and effective medical care (i.e., treating patients who have cardiovascular conditions); these deaths are defined as avoidable (2). Although no standard method for measuring avoidable deaths exists, Canada (3), the United Kingdom (4), and the European Union (5) have introduced avoidable death measures for their surveillance systems. In several previous studies, the United States ranked higher in avoidable death rates compared with other industrialized countries (6).

Heart disease is the leading cause of death in the United States, and cardiovascular disease accounts for nearly 30% of all deaths annually (nearly 800,000 deaths) (7). Many heart disease and stroke deaths could be avoided through improvements in lifestyle behaviors, treatment of risk factors, and addressing the social determinants of health (i.e., economic and social conditions that influence the health of individuals and communities). Unhealthy lifestyle behaviors (e.g., tobacco use, inadequate physical activity, poor diet, and excessive alcohol use) coupled with uncontrolled hypertension, elevated cholesterol, and obesity account for 80% of ischemic heart disease mortality and approximately 50% of stroke mortality in high-income countries such as the United States (8). Hypertension is the single most important risk factor for stroke, and its control is essential to reducing death from stroke (8). Additional medical interventions, such as secondary prevention and evidence-based procedures to treat ischemic heart disease and stroke, have been shown to reduce deaths in the United States (9,10).

This report describes the epidemiology of avoidable deaths from heart disease, stroke, and hypertensive disease in the United States, presents trends in avoidable death rates for these causes, and documents geographic disparities by state and county.

Methods

Mortality data from the National Vital Statistics System for the period 2001–2010 were analyzed. Bridged-race July 1 population estimates produced by the U.S. Census Bureau in collaboration with the National Center for Health Statistics were compiled using intercensal estimates for the period 2001–2009 and postcensal estimates for 2010.

In this report, avoidable deaths include all deaths among persons aged <75 years with an underlying cause of ischemic heart disease (International Classification of Diseases, 10th Revision [ICD-10] codes I20–I25), cerebrovascular disease (stroke) (I60–I69), hypertensive disease (I10–I15), or chronic rheumatic heart disease (I05–I09) (2). The analyses were limited to persons aged <75 years because the life expectancy of the total U.S. population in 2010 was 78.7, and 100% of these deaths in persons aged <75 years were considered to be preventable in accordance with previous analyses (3–5). Age-standardized death rates were calculated by sex, race/ethnicity,* and the decedent's state of residence at time of death, and trends were analyzed for the period 2001–2010 using joinpoint regression to calculate the average annual percentage change (AAPC). Rate comparisons were made using rate ratios (RRs). County-level rates for combined years 2008–2010 were calculated using a spatial empirical Bayesian smoothing technique to enhance the stability of the rates (11).

Results

In 2010, the total number of avoidable deaths from heart disease, stroke, and hypertensive disease was 200,070, and the death rate was 60.7 per 100,000 population (Table 1). Death rates in 2010 were highest in the oldest age group (65–74 years) (401.5 per 100,000) and lowest in the youngest age group (0–34 years) (1.9 per 100,000); however, 56% of the deaths (n = 112,329) occurred among those aged <65 years. Avoidable deaths were higher among males (83.7 per 100,000) than females (39.6) and blacks (107.3) compared with other races/ethnicities. Rates for blacks and American Indians/Alaska Natives were statistically significantly higher than those for whites (RR = 1.9 and 1.2, respectively), whereas rates for Hispanics and Asian/Pacific Islanders were significantly lower (RR = 0.8 and 0.6, respectively).

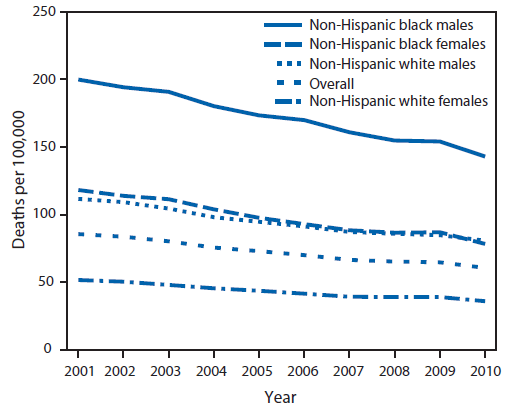
From 2001 to 2010, the avoidable death rate from heart disease, stroke, and hypertensive disease decreased 29%. The AAPC shows that rates decreased sharply for the 65–74 years age group (AAPC = -5.1), declined more gradually in the 55–64 years age group (AAPC = -3.3), declined minimally in the 35–54 years age group (AAPC = -0.8), and did not change in the youngest age group (Table 1). Declines occurred among both sexes and all race/ethnicity groups. Temporal trends for blacks and whites from 2001 to 2010 showed a decrease over time for all groups; however, black males consistently experienced the highest avoidable death rates throughout the period, and black females showed rates similar to white males (Figure 1).

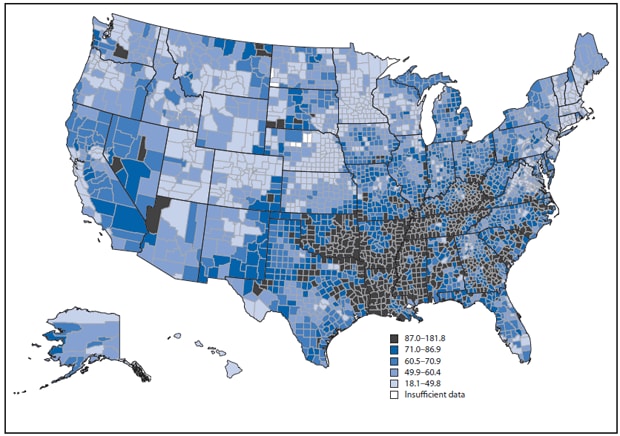
By state, avoidable deaths from heart disease, stroke, and hypertensive disease in 2010 ranged from 36.3 to 99.6 per 100,000 population in Minnesota and the District of Columbia, respectively, a greater than two-fold difference (Table 2). All states experienced declines in rates for these avoidable causes during 2001–2010, ranging from an AAPC of -1.6 in Wyoming to an AAPC of -6.1 in New Hampshire. By county, the highest avoidable death rates in combined years 2008 to 2010 were concentrated primarily in the southern Appalachian region and much of Tennessee, Arkansas, Mississippi, Louisiana, and Oklahoma, whereas the lowest rates were located in the West, Midwest, and Northeast census regions (Figure 2). Within states, substantial variation often occurred in the county rates, with some states experiencing a fourfold difference in death rates among counties (e.g., Colorado, Virginia, Kentucky, and Maryland).

Conclusions and Comment

Avoidable death rates from heart disease, stroke, and hypertensive disease in the United States vary by age, race/ethnicity, sex, place, and time. In 2010, an estimated 200,070 avoidable deaths from these causes occurred in the United States. Although the highest death rate occurred among those aged 65–74 years, the younger age groups (aged <65 years) still experienced a substantial number of avoidable deaths and a relatively slower rate of decline during 2001–2010. The avoidable death rate among blacks was nearly twice that of whites. Counties with the highest avoidable death rates were located primarily in the South census region.

The overall decrease in deaths from ischemic heart disease (the largest contributing cause of the avoidable deaths measured) can be attributed to both improvements in risk factors and changes in cardiac treatments (9). The variation in age-specific rates of decline for avoidable deaths from heart disease, stroke, and hypertensive disease, with slower declines in the younger age group, could have resulted from multiple factors. Differential temporal trends in the percentage of adults without health insurance by age group are one possibility. Whereas the percentage of adults aged 18–64 years with no health insurance increased from 17% in 2001 to 22% in 2010, it remained at ≤2% among adults aged ≥65 years (because of Medicare coverage in this population) (12). Although avoidable death rates in those aged ≥35 years have declined over this interval, the increase in percentage without insurance among the younger age groups might have limited their access to preventive screenings and early treatment of high blood pressure and elevated cholesterol and, therefore, contributed to their slower decline in rates (13,14). Age-specific differences in risk factor management also might have contributed to the slower decline in the younger age group. Compared with persons aged ≥60 years, during 2009–2010, adults aged 18–39 years with high blood pressure experienced lower rates of treatment (43.5% versus 83.6%) and control (28.6% versus 47.0%) and saw no improvements in those rates from 2001 to 2010 (15). Furthermore, among persons aged 35–44 years, stroke hospitalizations increased during 2001–2006, whereas they remained constant for those aged 45–54 years and decreased among those aged 55–64 years (16). The finding of a slower decline in avoidable deaths in younger age groups in this report highlights the importance of improving prevention, diagnosis, and treatment efforts in younger adults.

Blacks experienced a disproportionate number of avoidable deaths from heart disease, stroke, and hypertensive disease, with nearly twice the rate as whites. Risk for avoidable death is particularly high among black males; in 2010, their rate was approximately 80% higher than that of white males and black females. Compared with whites, blacks have higher prevalence of cardiovascular disease risk factors, including high blood pressure, diabetes, obesity, physical inactivity, low fruit and vegetable consumption, and poor low-density lipoprotein cholesterol control (13). In addition, previous studies suggest that the U.S. black-white disparity in avoidable mortality reflects differences in education, income, living conditions, and access to health care (2). Interventions aimed at addressing these social determinants of health in combination with effective treatment and control of risk factors could help reduce black-white disparities in avoidable deaths (17).

State-level and county-level differences in avoidable death rates from heart disease, stroke, and hypertensive disease suggest the need for interventions that target areas with the highest rates and work with the resources, policies, and programs already existing in those areas. In 2010, the states with the highest avoidable death rates were located primarily in the South (e.g., District of Columbia, Mississippi, Oklahoma, Tennessee, and Louisiana). The states with the lowest rates were Minnesota, Utah, Colorado, Connecticut, and New Hampshire. During 2001–2010, all states experienced declines in avoidable death rates; however, some of the states that already had the lowest rates saw some of the steepest declines in absolute percentage change and AAPC (e.g., New Hampshire and Rhode Island), whereas some states with the highest rates had the slowest declines (e.g., Oklahoma and Arkansas). Moreover, variation in avoidable deaths exists within states by county (Figure 2). These geographic disparities support the need for local-level policy changes and system-level changes (e.g., promoting community design that increases access to sidewalks and bike lanes, improving the local food environment, enhancing worksite wellness programs, and improving insurance coverage) to improve access to quality health care and enhance or create the physical, social, and built environments needed to support healthy lifestyles (18).

The findings in this report are subject to at least four limitations. First, ICD-10 codes might misclassify cause of death, especially for stroke; however, more classification issues typically are experienced among the very old, a population not included in this study (19). Second, race and ethnicity might not be reported accurately on death certificates; this typically leads to underreporting of American Indian/Alaska Native, Asian/Pacific Islander, and Hispanic race/ethnicity (20). Third, death rate data in this report are based on residency at time of death and not on the state in which a person spent the majority of his or her life. Finally, there is no universally agreed upon definition for avoidable heart disease and stroke deaths, which could limit ability to compare these results with other studies. The strength of the methodology used in this report (2) is that it focuses on both preventable and treatable conditions whereas other methodologies might focus on one or the other. Other definitions of avoidable deaths resulting from these causes could lead to differing estimates, but most likely similar trends and associations.

Strong collaboration between health care and public health is critical to reduce the burden of avoidable deaths from heart disease, stroke, and hypertensive disease. The Million Hearts initiative is a national effort working to improve access and quality of care to reduce the incidence of heart disease and stroke through community and clinical prevention strategies. These strategies include promoting the ABCS of heart health (aspirin when appropriate, blood pressure control, cholesterol management, and smoking cessation); use of health information technology (to help doctors track and treat patients with high blood pressure and elevated cholesterol); and team-based care (an evidence-based collaborative model that is more effective in controlling high blood pressure and cholesterol than a single health-care provider working alone), as well as community prevention strategies, including tobacco control and reducing sodium and eliminating trans fats from foods. In addition, state-level and local-level initiatives are working to enhance community and clinical collaborations. For example, the state of Massachusetts is developing an electronic referral system and data exchange to enhance communication between clinicians and community resources such as telephone quitlines for smokers, physical activity supports, and blood pressure self-management to prevent heart disease and stroke risk factors more effectively. The Sodium Reduction in Communities Program is a county-level effort to help reduce sodium in schools, restaurants, and other venues while also educating the public on sodium reduction (21). Reducing sodium in foods can aid in control of high blood pressure. Finally, individuals can work toward reducing their own heart disease and stroke risk. The American Heart Association has defined seven simple steps to a healthier heart to help individuals increase healthy behaviors (22). Although this report defined avoidable deaths as those occurring in persons aged <75 years based on life expectancy in the United States, these public health, health-care, community, and patient strategies can help reduce deaths from heart disease and stroke in the United States across all age groups.

Reported by

Linda J. Schieb, MSPH, Sophia A. Greer, MPH, Matthew D. Ritchey, DPT, Mary G. George, MD, Michele L. Casper, PhD, Div for Heart Disease and Stroke Prevention, National Center for Chronic Disease Prevention and Health Promotion, CDC. Corresponding contributor: Linda J. Schieb, [email protected], 770-488-5348.

Acknowledgments

Barbara A. Bowman, PhD, Yuling Hong, MD, PhD, Div for Heart Disease and Stroke Prevention, National Center for Chronic Disease Prevention and Health Promotion, CDC.

References

  1. Rutstein DD, Berenberg W, Chalmers TC, Child CG, Fishman AP, Perrin EB. Measuring the quality of medical care: a clinical method. N Engl J Med 1976; 294:582–8.
  2. Macinko J, Elo I. Black-white differences in avoidable mortality in the USA, 1980–2005. J Epidemiol Community Health 2009;63:715–21.
  3. Canadian Institute for Health Information. Health indicators 2012. Ottawa, Ontario: Canadian Institute for Health Information; 2012. Available at https://secure.cihi.ca/free_products/health_indicators_2012_en.pdf.
  4. Office for National Statistics. Avoidable mortality in England and Wales, 2011. Newport, Wales: Office for National Statistics ; 2013. Available at http://www.ons.gov.uk/ons/dcp171778_311826.pdf.
  5. AMIEHS. Avoidable mortality in the European Union: towards better indicators for the effectiveness of health systems. Rotterdam, Netherlands; 2011. Available at http://amiehs.lshtm.ac.uk/publications/reports/amiehs%20final%20report%20vol%20i.pdf.
  6. Nolte E, McKee CM. Measuring the health of nations: updating an earlier analysis. Health Aff (Millwood) 2008;27:58–71.
  7. Murphy SL, Xu J, Kochanek KD. Deaths: final data for 2010. Natl Vital Stat Rep 2013;61(4).
  8. Lopez AD, Mathers CD, Ezzati M, Jamison DT, Murray CJL, eds. Global burden of disease and risk factors. New York, NY: Oxford University Press; 2006.
  9. Ford ES, Capewell S. Proportion of the decline in cardiovascular disease mortality due to prevention versus treatment: public health versus clinical care. Annu Rev Public Health 2011;32:5–22.
  10. Towfighi A, Saver JL. Stroke declines from third to fourth leading cause of death in the United States: historical perspective and challenges ahead. Stroke 2011;42:2351–5.
  11. Anselin L, Kim YW, Syabri I. Web-based analytical tools for the exploration of spatial data. J Geographical Systems 2004;6:197–218.
  12. US Census Bureau. Health insurance historical tables (HIB series). Washington, DC: US Department of Commerce, US Census Bureau; 2012. Available at http://www.census.gov/hhes/www/hlthins/data/historical/HIB_tables.html
  13. Go AS, Mozaffarian D, Roger VL, et al. Heart disease and stroke statistics—2013 update: a report from the American Heart Association. Circulation 2013;127:e6–e245.
  14. CDC. Vital signs: awareness and treatment of uncontrolled hypertension among adults—United States, 2003–2010. MMWR 2012;61:703–9.
  15. Gu Q, Burt VL, Dillon CF, Yoon S. Trends in antihypertensive medication use and blood pressure control among united states adults with hypertension—the National Health and Nutrition Examination Survey, 2001 to 2010. Circulation 2012;126:2105–14.
  16. Towfighi A, Markovic D, Ovbiagele B. Recent patterns of sex-specific midlife stroke hospitalization rates in the United States. Stroke 2011;42:3029–33.
  17. Gottlieb L, Sandel M, Adler NE. Collecting and applying data on social determinants of health in health care settings. JAMA Intern Med 2013;173:1017–20.
  18. National Research Council and Institute of Medicine. U.S. health in international perspective: shorter lives, poorer health. Panel on understanding cross-national health differences among high-income countries. Washington, DC: National Academies Press; 2013.
  19. Corwin LE, Wolf PA, Kannel WB, McNamara PM. Accuracy of death certification of stroke: the Framingham Study. Stroke 1982;13:818–21.
  20. Arias E, Schauman WS, Eschbach K, Sorlie PD, Backlund E. The validity of race and Hispanic origin reporting on death certificates in the United States. Vital Health Stat 2 2008;148:1–23.
  21. Mugavero K, Losby JL, Gunn JP, Levings JL, Lane RI. Reducing sodium intake at the community level: the Sodium Reduction in Communities Program. Prev Chronic Dis 2012;9:E168.
  22. Lloyd-Jones DM, Hong Y, Labarthe D, et al. Defining and setting national goals for cardiovascular health promotion and disease reduction: the American Heart Association's strategic Impact Goal through 2020 and beyond. Circulation 2010;121:586–613.

* Persons of Hispanic ethnicity might be of any race or combination of races. Persons identified as any of the other racial/ethnic categories were non-Hispanic.

West: Alaska, Arizona, California, Colorado, Hawaii, Idaho, Montana, Nevada, New Mexico, Oregon, Utah, Washington, and Wyoming. Midwest: Illinois, Indiana, Iowa, Kansas, Michigan, Minnesota, Missouri, Nebraska, North Dakota, Ohio, South Dakota, and Wisconsin. Northeast: Connecticut, Maine, Massachusetts, New Hampshire, New Jersey, New York, Pennsylvania, Rhode Island, and Vermont. South: Alabama, Arkansas, Delaware, District of Columbia, Florida, Georgia, Kentucky, Louisiana, Maryland, Mississippi, Oklahoma, North Carolina, South Carolina, Tennessee, Texas, Virginia, and West Virginia.


Key Points

  • Minimal declines in avoidable deaths from heart disease, stroke, and hypertensive disease occurred in younger age groups (0–34 and 35–54 years) compared with older age groups (55–64 and 65–74 years).
  • Non-Hispanic blacks experience a disproportionately large number of avoidable deaths, with nearly twice the rate of avoidable death as non-Hispanic whites.
  • Rates of avoidable deaths from heart disease, stroke, and hypertensive disease are highest in the South.
  • Additional information is available at http://www.cdc.gov/vitalsigns.

TABLE 1. Number and rate of avoidable deaths* from heart disease, stroke, and hypertensive disease, by age, sex, and race/ethnicity — United States, 2001 and 2010

Characteristic

2001

2010

Average annual % change

2001 to 2010

No.

Rate

(95% CI)

No.

Rate

(95% CI)

Rate ratio

Total

227,961

85.7

(85.4–86.1)

200,070

60.7

(60.4–61.0)

-3.8§

Age group (yrs)

0–34

2,858

2.0

(2.0–2.1)

2,765

1.9

(1.8–2.0)

Referent

0.4

35–54

46,426

55.0

(54.5–55.5)

43,884

51.0

(50.6–51.5)

26.8§

-0.8§

55–64

61,015

243.0

(241.1–245.0)

65,680

178.6

(177.2–180.0)

94.0§

-3.3§

65–74

117,662

640.0

(636.4–643.7)

87,741

401.5

(398.8–404.1)

211.3§

-5.1§

Sex

Males

146,189

116.9

(116.3–117.5)

132,215

83.7

(83.2–84.2)

Referent

-3.7§

Females

81,772

57.9

(57.5–58.3)

67,855

39.6

(39.3–39.9)

0.5§

-4.1§

Race/Ethnicity and sex

White, non-Hispanic

168,732

80.4

(80.0–80.7)

142,448

57.8

(57.5–58.1)

Referent

-3.6§

Males

111,265

111.7

(111.0–112.4)

96,451

80.9

(80.3–81.4)

-3.5§

Females

57,467

51.7

(51.3–52.2)

45,997

36.1

(35.7–36.4)

-3.9§

Black, non-Hispanic

40,398

154.0

(152.5–155.6)

37,348

107.3

(106.2–108.5)

1.9§

-3.9§

Males

23,050

199.8

(197.2–202.5)

22,417

143.0

(141.1–144.9)

-3.6§

Females

17,348

118.3

(116.5–120.0)

14,931

78.4

(77.2–79.7)

-4.4§

Hispanic**

12,884

68.2

(67.0–69.4)

13,855

45.4

(44.7–46.2)

0.8§

-4.5§

Males

8,205

93.0

(91.0–95.1)

9,175

63.2

(61.8–64.5)

-4.3§

Females

4,679

46.8

(45.4–48.1)

4,680

29.7

(28.8–30.6)

-5.1§

AI/AN, non-Hispanic**

1,368

86.9

(82.1–91.6)

1,498

66.9

(63.5–70.4)

1.2§

-3.0§

Males

851

113.5

(105.7–121.4)

965

90.0

(84.2–95.8)

-2.5§

Females

517

63.1

(57.6–68.6)

533

45.9

(42.0–49.9)

-3.8§

Asian/Pacific Islander, non-Hispanic**

4,579

50.5

(49.0–52.0)

4,921

33.6

(32.6–34.5)

0.6§

-4.3§

Males

2,818

67.9

(65.3–70.4)

3,207

47.3

(45.7–49.0)

-3.7§

Females

1,761

36.0

(34.3–37.7)

1,714

21.9

(20.9–23.0)

-5.4§

Abbreviations: CI = confidence interval; AI/AN = American Indian/Alaska Native.

* Avoidable deaths from heart disease, stroke, and hypertensive disease are defined as all deaths occurring in persons aged <75 years with an underlying cause of ischemic heart disease, cerebrovascular disease, hypertensive disease, or chronic rheumatic heart disease.

Per 100,000 population. Rates are age-standardized to the U.S. standard 2000 population except for age-specific rates.

§ Statistically different from zero at alpha = 0.05.

Results based on small numbers.

** Numbers and rates for AI/ANs, Hispanics, and Asians/Pacific Islanders might be underreported because of coding issues on death certificates.


FIGURE 1. Age-adjusted rates* of avoidable death from heart disease, stroke, and hypertensive diseaseamong non-Hispanic blacks and non-Hispanic whites, by sex — United States, 2001–2010

The figure shows age-adjusted rates of avoidable death from heart disease, stroke, and hypertensive disease among non-Hispanic blacks and non-Hispanic whites, by sex, in the United States during 2001-2010. Temporal trends for blacks and whites from 2001 to 2010 showed a decrease over time for all groups; however, black males consistently experienced the highest avoidable death rates throughout the period, and black females showed rates similar to white males.

* Rates are age-standardized to the U.S. standard 2000 population.

Avoidable deaths from heart disease, stroke, and hypertensive disease are defined as all deaths occurring in persons aged <75 years with an underlying cause of ischemic heart disease, cerebrovascular disease, hypertensive disease, or chronic rheumatic heart disease.

Alternate Text: The figure above shows age-adjusted rates of avoidable death from heart disease, stroke, and hypertensive disease among non-Hispanic blacks and non-Hispanic whites, by sex, in the United States during 2001-2010. Temporal trends for blacks and whites from 2001 to 2010 showed a decrease over time for all groups; however, black males consistently experienced the highest avoidable death rates throughout the period, and black females showed rates similar to white males.


TABLE 2. Number and rate of avoidable deaths* from heart disease, stroke, and hypertensive disease, by state — United States, 2001 and 2010

State

2001

2010

Average annual % change 2001 to 2010§

No.

Rate

(95% CI)

No.

Rate

(95% CI)

Alabama

4,290

96.2

(93.3–99.1)

3,998

75.2

(72.8–77.5)

-2.5

Alaska

313

69.8

(61.7–77.9)

359

52.5

(46.9–58.1)

-2.6

Arizona

3,798

75.2

(72.8–77.5)

3,686

52.5

(50.8–54.2)

-3.8

Arkansas

2,910

106.5

(102.6–110.4)

2,849

87.5

(84.2–90.7)

-1.9

California

22,673

79.6

(78.5–80.6)

19,734

54.4

(53.6–55.1)

-4.3

Colorado

2,070

57.0

(54.5–59.5)

2,041

39.9

(38.1–41.7)

-3.9

Connecticut

2,203

66.0

(63.3–68.8)

1,651

41.8

(39.8–43.8)

-5.7

Delaware

682

85.9

(79.4–92.3)

613

59.8

(55.0–64.6)

-3.6

District of Columbia

718

137.8

(127.7–147.9)

580

99.6

(91.4–107.8)

-3.7

Florida

15,317

82.8

(81.5–84.1)

13,143

57.3

(56.3–58.3)

-4.1

Georgia

6,569

93.8

(91.6–96.1)

6,480

66.7

(65.1–68.4)

-4.0

Hawaii

769

63.9

(59.4–68.5)

666

44.1

(40.7–47.5)

-3.6

Idaho

775

67.4

(62.6–72.1)

790

49.0

(45.6–52.5)

-4.2

Illinois

10,096

89.9

(88.2–91.7)

8,182

61.9

(60.6–63.3)

-4.1

Indiana

5,069

88.8

(86.4–91.3)

4,438

64.4

(62.5–66.3)

-3.6

Iowa

2,322

80.3

(77.0–83.6)

1,999

60.4

(57.7–63.1)

-2.8

Kansas

1,797

72.6

(69.2–75.9)

1,521

51.6

(49.0–54.3)

-3.6

Kentucky

3,998

100.7

(97.6–103.9)

3,721

77.5

(74.9–80.0)

-2.8

Louisiana

4,575

111.6

(108.3–114.8)

4,167

87.8

(85.1–90.5)

-2.5

Maine

952

69.7

(65.2–74.1)

743

44.5

(41.3–47.8)

-5.0

Maryland

4,549

92.1

(89.5–94.8)

4,018

65.1

(63.0–67.1)

-3.4

Massachusetts

3,944

65.0

(63.0–67.1)

3,109

43.9

(42.3–45.4)

-4.2

Michigan

8,770

94.0

(92.0–96.0)

7,860

71.3

(69.7–72.9)

-3.1

Minnesota

2,546

57.7

(55.4–59.9)

2,012

36.3

(34.7–37.9)

-4.6

Mississippi

3,307

124.9

(120.6–129.1)

2,974

95.0

(91.5–98.4)

-2.9

Missouri

5,150

93.3

(90.8–95.9)

4,784

72.4

(70.3–74.4)

-2.7

Montana

570

62.1

(57.0–67.2)

623

53.1

(48.9–57.4)

-2.3

Nebraska

968

60.4

(56.6–64.2)

861

46.0

(42.9–49.1)

-3.3

Nevada

1,900

93.1

(88.9–97.3)

1,811

61.5

(58.7–64.4)

-4.0

New Hampshire

884

74.9

(69.9–79.8)

654

42.9

(39.5–46.2)

-6.1

New Jersey

6,321

77.1

(75.2–79.0)

4,933

52.1

(50.6–53.5)

-4.6

New Mexico

1,171

67.8

(63.9–71.7)

1,196

52.1

(49.2–55.1)

-2.8

New York

16,363

89.8

(88.4–91.1)

12,881

62.1

(61.0–63.2)

-3.8

North Carolina

7,443

95.0

(92.9–97.2)

6,730

64.7

(63.2–66.3)

-4.1

North Dakota

478

77.0

(70.1–83.9)

383

53.2

(47.8–58.7)

-4.4

Ohio

10,512

94.8

(93.0–96.6)

8,891

69.1

(67.7–70.6)

-3.5

Oklahoma

3,573

104.9

(101.5–108.4)

3,641

89.8

(86.9–92.8)

-2.6

Oregon

2,227

68.0

(65.1–70.8)

1,888

43.3

(41.4–45.3)

-4.8

Pennsylvania

10,664

82.7

(81.1–84.3)

8,417

58.0

(56.8–59.3)

-3.8

Rhode Island

830

82.0

(76.4–87.6)

597

52.3

(48.1–56.6)

-4.7

South Carolina

3,959

99.8

(96.7–102.9)

3,923

73.8

(71.5–76.2)

-3.5

South Dakota

527

72.9

(66.6–79.1)

468

53.1

(48.2–57.9)

-3.1

Tennessee

6,342

112.7

(109.9–115.4)

6,311

88.8

(86.6–91.0)

-2.9

Texas

16,477

94.3

(92.9–95.8)

15,241

64.4

(63.4–65.4)

-4.3

Utah

846

54.0

(50.3–57.6)

806

36.9

(34.4–39.5)

-3.3

Vermont

396

65.8

(59.3–72.3)

364

47.8

(42.8–52.8)

-3.8

Virginia

5,350

80.4

(78.2–82.6)

4,663

54.6

(53.0–56.2)

-4.2

Washington

3,796

72.7

(70.3–75.0)

3,400

47.1

(45.5–48.7)

-4.5

West Virginia

2,044

101.8

(97.4–106.3)

1,716

74.5

(70.9–78.1)

-3.6

Wisconsin

3,842

75.6

(73.2–78.0)

3,232

52.5

(50.7–54.3)

-3.8

Wyoming

316

66.2

(58.8–73.5)

322

52.8

(46.9–58.7)

-1.6

Abbreviation: CI = confidence interval.

* Avoidable deaths from heart disease, stroke, and hypertensive disease are defined as all deaths occurring in persons aged <75 years with an underlying cause of ischemic heart disease, cerebrovascular disease, hypertensive disease, or chronic rheumatic heart disease.

Per 100,000 population. Rates are age-standardized to the U.S. standard 2000 population.

§ All annual average percentage changes are statistically different from zero at alpha = 0.05.


FIGURE 2. Rates* of avoidable death from heart disease, stroke, and hypertensive disease, by county — United States, 2008–2010§

The figure shows rates of avoidable death from heart disease, stroke, and hypertensive disease, by county, in the United States during 2008-2010. By county, the highest avoidable death rates in 2010 were concentrated primarily in the southern Appalachian region and much of Tennessee, Arkansas, Mississippi, Louisiana, and Oklahoma, whereas the lowest rates were located in the West, Midwest, and Northeast census regions.

* Per 100,000 population. Rates are averaged over the 2008–2010 period and age-standardized to the U.S. standard 2000 population. Rates are spatially smoothed to enhance the stability of rates in counties with small populations.

Avoidable deaths from heart disease, stroke, and hypertensive disease are defined as all deaths occurring in persons aged <75 years with an underlying cause of ischemic heart disease, cerebrovascular disease, hypertensive disease, or chronic rheumatic heart disease.

§ Additional maps by race/ethnicity and sex are available on the Interactive Atlas for Heart Disease and Stroke at http://nccd.cdc.gov/dhdspatlas.

Alternate Text: The figure above shows rates of avoidable death from heart disease, stroke, and hypertensive disease, by county, in the United States during 2008-2010. By county, the highest avoidable death rates in 2010 were concentrated primarily in the southern Appalachian region and much of Tennessee, Arkansas, Mississippi, Louisiana, and Oklahoma, whereas the lowest rates were located in the West, Midwest, and Northeast census regions.


Use of trade names and commercial sources is for identification only and does not imply endorsement by the U.S. Department of Health and Human Services.

References to non-CDC sites on the Internet are provided as a service to MMWR readers and do not constitute or imply endorsement of these organizations or their programs by CDC or the U.S. Department of Health and Human Services. CDC is not responsible for the content of pages found at these sites. URL addresses listed in MMWR were current as of the date of publication.


All MMWR HTML versions of articles are electronic conversions from typeset documents. This conversion might result in character translation or format errors in the HTML version. Users are referred to the electronic PDF version (http://www.cdc.gov/mmwr) and/or the original MMWR paper copy for printable versions of official text, figures, and tables. An original paper copy of this issue can be obtained from the Superintendent of Documents, U.S. Government Printing Office (GPO), Washington, DC 20402-9371; telephone: (202) 512-1800. Contact GPO for current prices.

**Questions or messages regarding errors in formatting should be addressed to [email protected].

 
USA.gov: The U.S. Government's Official Web PortalDepartment of Health and Human Services
Centers for Disease Control and Prevention   1600 Clifton Road Atlanta, GA 30329-4027, USA
800-CDC-INFO (800-232-4636) TTY: (888) 232-6348 - Contact CDC–INFO
A-Z Index
  1. A
  2. B
  3. C
  4. D
  5. E
  6. F
  7. G
  8. H
  9. I
  10. J
  11. K
  12. L
  13. M
  14. N
  15. O
  16. P
  17. Q
  18. R
  19. S
  20. T
  21. U
  22. V
  23. W
  24. X
  25. Y
  26. Z
  27. #