 |
|
|
|
|
|
|
| ||||||||||
|
|
|
|
|
|
|
||||
| ||||||||||
|
|
|
|
|
Persons using assistive technology might not be able to fully access information in this file. For assistance, please send e-mail to: [email protected]. Type 508 Accommodation and the title of the report in the subject line of e-mail. Surveillance of Certain Health Behaviors and Conditions Among States and Selected Local Areas --- Behavioral Risk Factor Surveillance System (BRFSS), United States, 2006Prepared by
Corresponding author: Greta Kilmer, MS, Division of Adult and Community Health, National Center for Chronic Disease Prevention and Health Promotion, 2990 Brandywine Road, MS E-65, Atlanta, GA 30341. Telephone: 678-530-8953; Fax: 678-530-9958; E-mail: [email protected]. AbstractProblem: Behavioral risk factors such as smoking, poor diet, physical inactivity, and excessive drinking are linked to the leading causes of death in the United States. Controlling these behavioral risk factors and using preventive health services (e.g., influenza vaccinations and cholesterol screenings) can reduce morbidity and mortality in the U.S. population substantially. Continuous monitoring both of health behaviors and of the use of preventive services is essential for developing health promotion activities, intervention programs, and health policies at the state, city, and county level. Reporting Period Covered: January--December 2006. Description of the System: The Behavioral Risk Factor Surveillance System (BRFSS) is an ongoing, state-based, random-digit--dialed telephone survey of the noninstitutionalized U.S. population aged >18 years. BRFSS collects data on health-risk behaviors and use of preventive health services related to the leading causes of death and disability in the United States. This report presents results for 2006 for all 50 states, DC, Puerto Rico, the U.S. Virgin Islands, 145 selected metropolitan and micropolitan statistical areas (MMSAs), and 234 corresponding counties. Results: Prevalence estimates of risk behaviors, chronic conditions, and the use of preventive services varied substantially by state and territory, MMSA, and county. In 2006, the estimated prevalence of fair or poor health ranged from 11% to 33% for states and territories, from 8% to 24% for MMSAs, and from 5% to 24% for counties. The estimated prevalence of health-care coverage ranged from 61% to 96% for states and territories, MMSAs, and counties. The estimated prevalence of teeth extraction among adults aged >65 years was lowest in Hawaii (10%) and highest in Kentucky (39%) and West Virginia (41%). The estimated prevalence of activity limitation as a result of physical, mental, or emotional problems ranged from 10% to 28% for states and territories, from 13% to 36% for MMSAs, and from 11% to 29% for counties. The estimated prevalence of adults who had a recent routine checkup ranged from 45% to 81% for states and territories, MMSAs, and counties. The estimated prevalence of annual influenza vaccination among adults aged >65 years was lowest in Puerto Rico (33%) and highest in Colorado (76%). The estimated prevalence of pneumococcal vaccination among older adults ranged from 30% to 75% for states and territories, from 52% to 80% for MMSAs, and from 42% to 82% for counties. The estimated prevalence of sigmoidoscopy/colonoscopy among adults aged >50 years ranged from 38% to 84% for states and territories, MMSAs, and counties. The estimated prevalence among adults aged >50 years who had a blood stool test during the preceding 2 years was lowest in Puerto Rico (5%) and highest in DC and Maine (33%). The estimated prevalence among women having a Papanicolaou (Pap) test during the preceding 3 years ranged from 72% to 89% for states and territories, from 75% to 94% for MMSAs, and from 75% to 95% in counties. The estimated prevalence among women aged >40 years having a mammogram during the preceding 2 years ranged from 60% to 89% for states and territories, MMSAs, and counties. The estimated prevalence among men aged >40 years who had a prostate-specific antigen (PSA) test during the preceding 2 years was lowest in Hawaii (40%) and highest in Puerto Rico (66%). The estimated prevalence of cigarette smoking ranged from 9% to 29% for states and territories and from 6% to 31% for MMSAs and counties. The estimated prevalence of binge drinking was lowest in Kentucky and Tennessee (9%) and highest in Wisconsin (24%). The estimated prevalence of leisure-time physical inactivity ranged from 11% to 41% for states and territories, MMSAs, and counties. Seat belt use was lowest in North and South Dakota (58%) and highest in California, Hawaii, and Washington (92%). The estimated prevalence among adults who were overweight ranged from 32% to 40% for states and territories, from 31% to 45% for MMSAs, and from 24% to 49% for counties. The estimated prevalence of obesity ranged from 10% to 46% for states and territories, MMSAs, and counties. The estimated current asthma prevalence ranged from 3% to 14% for states and territories, MMSAs, and counties. The estimated prevalence of diabetes ranged from 2% to 13% for states and territories, MMSAs, and counties. The estimated prevalence of coronary heart disease among adults aged >45 years ranged from 5% to 20% for states and territories. The estimated prevalence of a history of stroke history among adults aged >45 years ranged from 2% to 10% for states and territories, MMSAs, and counties. Interpretation: This report indicates that substantial variations in health-risk behaviors, chronic diseases and conditions, and the use of preventive health services exist among adults from state to state and within states and underscores the continued need for prevention and health promotion activities at the local, state, and federal levels. Public Health Action: Healthy People 2010 objectives have been established to monitor health behaviors and the use of preventive health services. Local and state health departments and federal agencies use BRFSS data to measure progress toward achieving national and local health objectives. Continued surveillance is needed to design, implement, and evaluate public health policies and programs that can lead to a reduction in morbidity and mortality from the effects of health-risk behaviors and subsequent chronic conditions. IntroductionThe leading causes of death in the United States include chronic diseases (e.g., heart disease and cancer), injuries (e.g., suicides and accidents), and preventable infectious diseases (e.g., influenza and pneumonia) (1). The risk factors associated with the leading causes of death include personal health behaviors (e.g., cigarette smoking) and nonuse of health services (e.g. cancer screenings) (2). The estimated prevalence of these risk factors varies across the United States, and constant surveillance is necessary to identify groups at highest risk. The Behavioral Risk Factor Surveillance System (BRFSS) is an ongoing, state-based surveillance system that is used to monitor progress in achieving national health goals and to direct the public health making decision process. BRFSS has been a source of data since 1984 and is the largest continuously conducted telephone survey in the world. Because of the large sample size, estimates are available for 53 states and territories and for 145 metropolitan and micropolitan statistical areas (MMSAs) and 234 counties across the United States. Healthy People 2010 objectives have been established to monitor health behaviors and the use of preventive health services. Communities that achieve these goals are expected to attain decreased morbidity and premature mortality by preventing associated risk factors (3). This report contains comparisons between 2006 BRFSS data and Healthy People 2010 objectives. MethodsIn 2006, BRFSS was conducted in all 50 states, the District of Columbia (DC), Puerto Rico, and the U.S. Virgin Islands. BRFSS uses a multistage sampling design based on random-digit--dialing methods to select a representative sample of the noninstitutionalized civilian population aged >18 years in each state and territory. The primary focus of BRFSS is to monitor the use of preventive services and the health behaviors and conditions that are linked with the leading causes of death. Details on the design, random sampling procedures, and reliability and validity of measures used in BRFSS have been described previously (4). QuestionnaireThe 2006 BRFSS questionnaire contained three components: 1) standardized core questions asked of all study respondents in all states and territories, 2) optional modules containing standardized questions on specific health-related topics that states and territories could select to include in their surveys, and 3) additional questions developed for and used by one or more states and territories to address specific health-care concerns. The core questions addressed demographics, health status, number of healthy days, access to health care, physical activity, diabetes, oral health, cardiovascular disease, asthma, disabilities, tobacco/cigarette use, veteran's status, alcohol consumption, adult influenza immunization, slips and falls, seatbelt use, drinking and driving, women's health issues, prostate cancer screening, colorectal cancer screening, human immunodeficiency virus/acquired immunodeficiency syndrome (HIV/AIDS), and emotional support and life satisfaction. The state-optional modules included sets of questions related to diabetes (selected by 48 states), anxiety and depression (41 states), random child selection (39 states), childhood asthma prevalence (38 states), secondhand smoke policy (22 states), folic acid (15 states), adult asthma history (14 states), sexual violence (13 states), child influenza vaccine supplement (nine states), intimate partner violence (nine states), visual impairment and access to eye care (nine states), family planning (eight states), general preparedness (four states), number of healthy days (four states), indoor air quality (two states), reactions to race (two states), and home environment (one state). This report focuses on 1) health status indicators (health-care coverage, oral health, and disability), 2) health-risk behaviors (no leisure-time physical activity, current cigarette smoking, binge drinking, and seat belt use), 3) preventive practices (i.e., recent routine checkup; influenza and pneumococcal vaccinations for persons aged >65 years; and use of preventive health screenings for cancer [Papanicolaou (Pap) test, mammogram, colorectal cancer screening [sigmoidoscopy, colonoscopy, and blood stool test], and prostate cancer screening [prostate-specific antigen (PSA) test]), 4) chronic conditions (prevalence of diabetes, asthma, and adults who were overweight or obese), and 5) cardiovascular disease (coronary heart disease [CHD] and a history of stroke). Data Collection and ProcessingTrained interviewers administer BRFSS using a computer-assisted telephone interviewing (CATI) system. Data are collected monthly by each state and territory. After the monthly interviewing cycle ends, data are submitted to CDC, which checks the data for reliability. Data WeightingAt the end of the survey year, CDC edits and aggregates the monthly data files to create a yearly sample for each state. For this analysis, each sample was weighted to the respondent's probability of selection and to the age- and sex-specific population or age-, sex-, and race-specific population data using the 2006 census projections reported by the Census Bureau for each state. These sampling weights were used to calculate state-, MMSA-, and county-level prevalence estimates. MMSAs used in this report were those defined by the Office of Management and Budget. Respondents were assigned to a particular MMSA on the basis of their Federal Information Processing Standard (FIPS) county code. Detailed weighting and analytic methodologies have been documented previously (4). Statistical AnalysesSAS® and SUDAAN® (release 9.0.1; Research Triangle Institute, Research Triangle Park, North Carolina) were used in the analyses to account for the complex sampling design and calculate prevalence estimates, standard errors, and 95% confidence intervals (CIs) (5,6). Statistics were not reported if the unweighted sample size for the denominator was <50 or the CI half width was >10. Only MMSAs with >500 respondents or >19 respondents per weighting class were included. Counties were excluded if the estimated population was <10,000 persons. Responses coded as "do not know" or "refused" were excluded from the analyses. ResultsIn 2006, a total of 355,710 interviews were completed. Data were collected from all 50 states, DC, Puerto Rico, and the U.S. Virgin Islands. This report presents results for 2006 from 145 selected MMSAs and 234 corresponding counties. The number of interviews completed ranged from 1,953 in Alaska to 22,973 in Washington (median: 5,292), and the Council of American Survey and Research Organization (CASRO) response rates ranged from 35.1% in New Jersey to 66.0% in Nebraska (median: 51.4%). Health IndicatorsHealth Status Respondents were asked to rate their general health as poor, fair, good, very good, or excellent. Respondents were classified into two groups: those who reported fair or poor health and those who reported good, very good, or excellent health. In 2006, the estimated prevalence of fair or poor health among adults aged >18 years ranged from 10.8% (95% CI = 9.8%--11.8%) in Minnesota to 32.9% (95% CI = 31.4%--34.4%) in Puerto Rico (median: 14.7%) (Table 1). Among selected MMSAs, the estimated prevalence among respondents who had fair or poor health ranged from 8.2% (95% CI = 7.0%--9.4%) in Burlington-South Burlington, Vermont to 24.3% (95% CI = 16.2%--32.4%) in Huntington-Ashland, West Virginia-Kentucky-Ohio (median: 14.4%) (Table 2). Among selected counties, the estimated prevalence ranged from 5.1% (95% CI = 2.4%--7.8%) in Douglas County, Colorado to 24.0% (95% CI = 17.7%--30.3%) in Franklin County, Washington (median: 13.9%) (Table 3). Health-Care Coverage Health-care coverage was defined as respondents having reported that they had private health insurance, prepaid plans (e.g., health maintenance organizations) or government health plans (e.g., Medicare or Medicaid). In 2006, the estimated prevalence among adults aged >18 years who had health-care coverage ranged from 70.2% (95% CI = 68.2%--72.2%) in the U.S. Virgin Islands to 92.4% (95% CI = 91.4%--93.4%) in Puerto Rico (median: 85.5%) (Table 4). Among selected MMSAs, the estimated prevalence ranged from 60.9% (95% CI = 55.6%--66.2%) in El Paso, Texas to 93.8% (95% CI = 91.3%--96.3%) in Nassau-Suffolk, New York (median: 86.3%) (Table 5). Among selected counties, the estimated prevalence ranged from 60.9% (95% CI = 55.6%--66.2%) in El Paso County, Texas to 96.1% (95% CI = 93.7%--98.5%) in Howard County, Maryland (median: 86.8%) (Table 6). Oral Health-Teeth Extraction Oral health status was assessed by asking respondents aged >65 years, "How many of your permanent teeth have been removed because of tooth decay or gum disease?" In 2006, the estimated prevalence among adults aged >65 years who had all of their natural teeth extracted ranged from 9.6% (95% CI = 7.6%--11.6%) in Hawaii to 40.5% (95% CI = 37.2%--43.8%) in West Virginia (median: 19.3%) (Table 7). Among selected MMSAs, the estimated prevalence ranged from 7.1% (95% CI = 4.2%--10.0%) in Hilo, Hawaii, to 48.1% (95% CI = 38.2%--58.0%) in Huntington-Ashland, West Virginia-Kentucky-Ohio (median: 17.3%) (Table 8). Among selected counties, the estimated prevalence ranged from 5.1% (95% CI = 1.8%--8.4%) in Middlesex County, Connecticut to 37.8% (95% CI = 28.4%--47.2%) in Kanawha County, West Virginia (median: 16.4%) (Table 9). Disability-Limited Activity In 2006, the estimated prevalence among adults >18 years who reported limitations in activities because of physical, mental, or emotional problems ranged from 10.1% (95% CI = 8.9%--11.3%) in the U.S. Virgin Islands to 27.7% (95% CI =26.1%--29.3%) in Kentucky (median: 19.9%) (Table 10). Among selected MMSAs, the estimated prevalence ranged from 12.8% (95% CI = 11.5%--14.1%) in Honolulu, Hawaii to 35.8% (95% CI = 27.6%--44.0%) in Huntington-Ashland, West Virginia-Kentucky-Ohio (median: 19.3%) (Table 11). Among selected counties, the estimated prevalence ranged from 10.9% (95% CI = 7.8%--14.0%) in Dallas County, Texas to 28.6% (95% CI = 22.5%--34.7%) in Nez Perce County, Idaho (median: 19.1%) (Table 12). Preventive PracticesRecent Routine Checkup A routine checkup is defined as a general physical examination, not an examination for a specific injury, illness, or condition. Respondents were defined as having a recent routine checkup if they reported visiting a doctor for a routine checkup during the preceding year. In 2006, the estimated prevalence among adults aged >18 years who had a recent routine checkup ranged from 53.3% (95% CI = 51.3%--55.3%) in Utah to 80.3% (95% CI = 78.6%--82.0%) in Rhode Island (median: 65.9%) (Table 13). Among selected MMSAs, the estimated prevalence ranged from 46.0% (95% CI = 40.2%--51.8%) in Provo-Orem, Utah to 79.7% (95% CI = 78.1%--81.3%) in Providence-New Bedford-Fall River, Rhode Island-Massachusetts (median: 66.9%) (Table 14). Among selected counties, the estimated prevalence ranged from 45.4% (95% CI = 39.6%--51.2%) in Utah County, Utah to 80.9% (95% CI = 78.7%--83.1%) in Providence County, Rhode Island (median: 68.4%) (Table 15). Influenza Vaccination In 2006, the estimated prevalence among adults aged >65 years who had received an influenza vaccination during the preceding 12 months ranged from 33.1% (95% CI = 30.2%--36.0%) in Puerto Rico to 75.9% (95% CI = 73.4%--78.4%) in Colorado (median: 69.1%) (Table 16). Among selected MMSAs, the estimated prevalence ranged from 54.1% (95% CI = 47.7%--60.5%) in Las Vegas-Paradise, Nevada to 80.9% in Denver-Aurora, Colorado (95% CI = 77.4%--84.4%) and Kapaa, Hawaii (95% CI = 72.9%--88.9%) (median: 69.3%) (Table 17). Among selected counties, the estimated prevalence ranged from 42.6% (95% CI = 35.1%--50.1%) in Miami-Dade County, Florida to 90.2% (95% CI = 81.6%--98.8%) in Howard County, Maryland (median: 70.7%) (Table 18). Pneumococcal Vaccination In 2006, the estimated prevalence among adults aged >65 years who had ever had a pneumococcal vaccination ranged from 29.5% (95% CI = 26.6%--32.4%) in Puerto Rico to 74.7% (95% CI = 72.1%--77.3%) in Oregon (median: 66.8%) (Table 19). Among selected MMSAs, the estimated prevalence ranged from 52.4% (95% CI = 47.8--57.0%) in Miami-Fort Lauderdale-Miami Beach, Florida to 79.6% (95% CI = 72.0%--87.2%) in Billings, Montana (median: 67.2%) (Table 20). Among selected counties, the estimated prevalence ranged from 42.2% (95% CI = 34.7%--49.7%) in Miami-Dade County, Florida to 82.1% (95% CI = 75.3%--88.9%) in Denver County, Colorado (median: 68.0%) (Table 21). Cancer Prevention Sigmoidoscopy or Colonoscopy. In 2006, the estimated prevalence among adults aged >50 years who ever had a sigmoidoscopy or colonoscopy ranged from 37.8% in Puerto Rico (95% CI = 35.7%--39.9%) and the U.S. Virgin Islands (95% CI = 34.8%--40.8%) to 69.2% (95% CI = 67.1%--71.3%) in Rhode Island (median: 57.1%) (Table 22). Among selected MMSAs, the estimated prevalence ranged from 44.9% (95% CI = 39.0%--50.8%) in Scottsbluff, Nebraska to 72.4% (95% CI = 67.5%--77.3%) in Barre, Vermont (median: 61.0%) (Table 23). Among selected counties, the estimated prevalence ranged from 43.9% (95% CI = 36.8%--51.0%) in Lake County, Indiana to 83.6% (95% CI = 77.1%--90.1%) in Westchester County, New York (median: 62.2%) (Table 24). Blood Stool Test. In 2006, the estimated prevalence among adults aged >50 years who had a blood stool test during the preceding 2 years ranged from 5.1% (95% CI = 4.1%--6.1%) in Puerto Rico to 32.5% in DC (95% CI = 29.9%--35.1%) and Maine (95% CI = 30.3%--34.7%) (median: 24.1%) (Table 25). Among selected MMSAs, the estimated prevalence ranged from 8.9% (95% CI = 4.6%--13.2%) in Provo-Orem, Utah to 43.5% (95% CI = 38.1%--48.9%) in Greensboro-High Point, North Carolina (median: 25.0%) (Table 26). Among selected counties, the estimated prevalence ranged from 6.1% (95% CI = 2.6%--9.6%) in Weber County, Utah to 46.6% (95% CI = 39.0%--54.2%) in Guilford County, North Carolina (median: 24.9%) (Table 27). Pap Test. In 2006, the estimated prevalence among women aged >18 years who had a Pap test during the preceding 3 years ranged from 72.3% (95% CI = 69.8%--74.8%) in Puerto Rico to 89.4% (95% CI = 87.5%--91.3%) in DC (median: 84.0%) (Table 28). Among selected MMSAs, the estimated prevalence ranged from 74.7% (95% CI = 67.1%--82.3%) in Farmington, New Mexico to 93.9% (95% CI = 90.9%--96.9%) in Dallas-Plano-Irving, Texas (median: 85.9%) (Table 29). Among selected counties, the estimated prevalence ranged from 74.7% (95% CI = 67.1%--82.3%) in San Juan County, New Mexico to 95.4% (95% CI = 91.9%--98.9%) in Summit County, Utah (median: 86.7%) (Table 30). Mammogram. In 2006, the estimated prevalence among women aged >40 years who had a mammogram during the preceding 2 years ranged from 61.3% (95% CI = 58.1%--64.5%) in the U.S. Virgin Islands to 84.8% (95% CI = 83.5%--86.1%) in Massachusetts (median: 76.5%) (Table 31). Among selected MMSAs, the estimated prevalence ranged from 60.6% (95% CI = 53.1%--68.1%) in Provo-Orem, Utah to 87.8% (95% CI = 83.3%--92.3%) in San Francisco-Oakland-Fremont, California (median: 77.8%) (Table 32). Among selected counties, the estimated prevalence ranged from 60.0% (95% CI = 52.3%--67.7%) in Utah County, Utah to 88.9% (95% CI = 83.6%--94.2%) in Durham County, North Carolina (median: 78.3%) (Table 33). Prostate-Specific Antigen Test. The prostate-specific antigen (PSA) test is a blood test that measures the level of PSA, an enzyme that is produced only by the prostate gland. High levels of PSA in the blood can indicate the development of early-stage prostate cancer. The PSA test also is used to determine any change in results from previous PSA levels. In 2006, the estimated prevalence among men aged >40 years who had a PSA test during the preceding 2 years ranged from 40.0% (95% CI = 37.2%--42.8%) in Hawaii to 65.7% (95% CI = 62.5%--68.9%) in Puerto Rico (median: 53.8%) (Table 34). Among selected MMSAs, the estimated prevalence ranged from 39.5% (95% CI = 31.5%--47.5%) in San Francisco-Oakland-Fremont, California to 66.9% (95% CI = 59.1%--74.7%) in Orlando-Kissimmee, Florida (median: 53.8%) (Table 35). Among selected counties, the estimated prevalence ranged from 39.7% (95% CI = 36.0%--43.4%) in Honolulu County, Hawaii to 71.7% (95% CI = 64.5%--78.9%) in Ocean County, New Jersey (median: 53.4%) (Table 36). Health-Risk BehaviorsCurrent Cigarette Smoking Respondents were classified as current smokers if they reported having smoked at least 100 cigarettes during their lifetime and indicated that they smoked every day or some days at the time of the survey. In 2006, the estimated prevalence of current cigarette smoking among adults >18 years ranged from 8.9% (95% CI = 7.7%--10.1%) in the U.S. Virgin Islands to 28.5% (95% CI = 26.7%--30.3%) in Kentucky (median: 20.0%) (Table 37). Among selected MMSAs, the estimated prevalence of current smoking ranged from 5.9% (95% CI = 3.5%--8.3%) in Provo-Orem, Utah to 31.2% (95% CI = 26.9%--35.5%) in Casper, Wyoming (median: 19.5%) (Table 38). Among selected counties, the estimated prevalence ranged from 5.7% (95% CI = 3.3%--8.1%) in Utah County, Utah to 31.2% (95% CI = 26.9%--35.5%) in Natrona County, Wyoming (median: 18.9%) (Table 39). Binge Drinking Binge drinking was defined as having five or more drinks on at least one occasion during the preceding month. In 2006, the estimated prevalence of binge drinking among adults aged >18 years ranged from 8.6% in Kentucky (95% CI = 7.3%--9.9%) and Tennessee (95% CI = 7.0%--10.2%) to 24.3% (95% CI = 22.6%--26.0%) in Wisconsin (median: 15.4%) (Table 40). Among selected MMSAs, the estimated prevalence of binge drinking ranged from 5.5% (95% CI = 2.9%--8.1%) in Provo-Orem, Utah to 24.8% (95% CI = 18.5%--31.1%) in Fargo, North Dakota-Minnesota (median: 15.0%) (Table 41). Among selected counties, the estimated prevalence ranged from 4.7% (95% CI = 2.2%--7.2%) in DeSoto county, Mississippi to 24.9% (95% CI = 16.6%--33.2%) in St. Louis City, Missouri (median: 15.2%) (Table 42). Leisure-Time Physical Inactivity Leisure-time physical inactivity was defined as the respondent not participating in exercise (e.g., running, calisthenics, golf, gardening, or walking) other than as a part of the respondent's regular job during the preceding month. In 2006, the estimated prevalence of physical inactivity among adults >18 years ranged from 14.2% (95% CI = 12.9%--15.5%) in Minnesota to 41.2% (95% CI = 39.5%--42.9%) in Puerto Rico (median: 22.8%) (Table 43). Among selected MMSAs, respondents reporting physical inactivity ranged from 12.9% (95% CI = 11.2%--14.6%) in Minneapolis-St. Paul-Bloomington, Minnesota-Wisconsin to 31.4% in El Paso, Texas (95% CI = 26.5%--36.3%) and Huntington- Ashland, West Virginia-Kentucky-Ohio (CI= 23.8%--39.0%) (median: 21.8%) (Table 44). Among selected counties, the estimated prevalence ranged from 10.6% in Orange County, North Carolina (95% CI = 7.0%--14.2%) and Douglas County, Colorado (95% CI = 6.8%--14.4%) to 36.1% (95% CI = 31.5%--40.7%) in Hudson County, New Jersey (median: 21.6%) (Table 45). Seat Belt Use In 2006, the estimated prevalence among adults aged >18 years who always wore seat belts when driving or riding in a car ranged from 58.4% in North Dakota (95% CI = 56.5%--60.3%) and South Dakota (95% CI = 56.7%--60.1%) to 91.9% (95% CI = 90.9%--92.9%) in California (median: 79.9%) (Table 46). Among selected MMSAs, the estimated prevalence of respondents who always wore seat belts ranged from 58.8% (95% CI = 53.4%--64.2%) in Scottsbluff, Nebraska to 93.3% (95% CI = 91.0%--95.6%) in Los Angeles-Long Beach-Glendale, California (median: 83.3%) (Table 47). Among selected counties, the estimated prevalence ranged from 58.0% (95% CI = 52.5%--63.5%) in Scotts Bluff County, Nebraska to 94.1% (95% CI = 91.5%--96.7%) in Douglas County, Washington (median: 84.8%) (Table 48). Chronic ConditionsOverweight Self-reported weight and height were used to calculate body mass index (BMI) (weight [kg]/height [m2]). Respondents were classified as being overweight if they had a BMI of >25.0 and <30.0. In 2006, the estimated prevalence among adults aged >18 years who were overweight ranged from 32.1% (95% CI = 30.1%--34.1%) in DC to 39.6% (95% CI = 37.6%--41.6%) in Rhode Island (median: 36.5%) (Table 49). Among selected MMSAs, the estimated prevalence ranged from 30.5% (95% CI = 25.9%--35.1%) in Memphis, Tennessee-Mississippi-Arkansas to 44.6% (95% CI = 36.7%--52.5%) in Toledo, Ohio (median: 36.4%) (Table 50). Among selected counties, the estimated prevalence ranged from 23.6% (95% CI =15.3%--31.9%) in Hamilton County, Ohio to 48.7% (95% CI = 42.0%--55.4%) in Newport County, Rhode Island (median: 36.8%) (Table 51). Obesity Respondents were classified as obese if their BMI was >30.0. Obesity analyses were restricted to adults aged >20 years to permit comparison with Healthy People 2010 objectives (3). In 2006, the estimated prevalence of obesity among adults aged >20 years ranged from 18.7% (95% CI = 17.5%--19.9%) in Colorado to 31.9% (95% CI = 30.3%--33.5%) in Mississippi (median: 25.8%) (Table 52). Among selected MMSAs, the estimated prevalence ranged from 14.6% (95% CI = 11.0%--18.2%) in Santa Fe, New Mexico to 45.5% (95% CI = 37.0%--54.0%) in Huntington-Ashland, West Virginia-Kentucky-Ohio (median: 25.1%) (Table 53). Among selected counties, the estimated prevalence ranged from 9.8% (95% CI = 5.6%--14.0%) in Summit County, Utah to 36.9% (95% CI = 30.3%--43.5%) in Charles County, Maryland (median: 24.4%) (Table 54). Asthma Respondents were defined as currently having asthma if they reported having ever been told by a doctor, nurse, or other health-care professional that they had asthma and still had asthma at the time of the survey. In 2006, the estimated prevalence of current asthma among adults aged >18 years ranged from 4.5% (95% CI = 3.6%--5.4%) in the U.S. Virgin Islands to 10.5 % (95% CI =9.3%--11.7%) in Rhode Island (median: 8.4%) (Table 55). Among selected MMSAs, the estimated prevalence of asthma ranged from 4.5% (95% CI = 2.2%--6.8%) in Dallas-Plano-Irving, Texas to 12.1% (95% CI = 9.1%--15.1%) in Essex County, Massachusetts (median: 8.4%) (Table 56). Among selected counties, the estimated prevalence ranged from 3.0% (95% CI = 1.7%--4.3%) in Somerset County, New Jersey to 13.8% (95% CI = 3.9%--23.7%) in Lorain County, Ohio (median: 8.3%) (Table 57). Diabetes Diabetes status was assessed by asking respondents, "Have you been told by a doctor that you have diabetes?" Respondents reporting gestational diabetes or prediabetes were not considered diabetic for these analyses. In 2006, the estimated prevalence of diagnosed diabetes among adults aged >18 years ranged from 5.3% (95% CI = 4.7%--5.9%) in Colorado to 12.1% (95% CI = 11.0%--13.2%) in West Virginia (median: 7.5%) (Table 58). Among selected MMSAs, the estimated prevalence of diagnosed diabetes ranged from 3.8% (95% CI = 2.0%--5.6%) in Kalispell, Montana to 12.7% (95% CI = 8.7%--16.7%) in Huntington-Ashland, West Virginia-Kentucky-Ohio (median: 7.5%) (Table 59). Among selected counties, the estimated prevalence ranged from 2.4% (95% CI = 0.3%--4.5%) in Summit County, Utah to 12.9% (95% CI = 8.9%--16.9%) in Gaston County, North Carolina (median: 7.4%) (Table 60). Cardiovascular DiseaseCoronary Heart Disease Respondents were classified as having CHD if they reported having ever been told by a doctor that they had CHD, including heart attack or angina. CHD analyses were restricted to adults aged >45 years. In 2006, the estimated prevalence of CHD among adults aged >45 years ranged from 5.2% (95% CI = 3.9%--6.5%) in the U.S. Virgin Islands to 19.7% (95% CI = 18.1%--21.3%) in West Virginia (median: 11.8%) (Table 61). Among selected MMSAs, the estimated prevalence of CHD ranged from 6.1% (95% CI = 3.6%--8.6%) in Billings, Montana to 21.6% (95% CI = 15.3%--27.9%) in Huntington-Ashland, West Virginia-Kentucky-Ohio (median: 11.4%) (Table 62). Among selected counties, the estimated prevalence ranged from 5.6% (95% CI = 1.2%--10.0%) in Summit County, Utah to 20.0% (95% CI = 14.8%--25.2%) in Luzerne County, Pennsylvania (median: 10.9%) (Table 63). Stroke Respondents were classified as having a history of stroke if they reported having ever been told by a doctor that they had a stroke. Stroke analyses were restricted to adults aged >45 years. In 2006, the estimated prevalence of stroke among adults aged >45 years ranged from 3.0% (95% CI = 2.4%--3.6%) in Puerto Rico to 7.7% (95% CI = 6.5%--8.9%) in Alabama (median: 4.7%) (Table 64). Among selected MMSAs, the estimated prevalence of stroke ranged from 2.1% (95% CI = 1.0%--3.2%) in Barre, Vermont to 8.7% (95% CI = 5.2%--12.2%) in Riverside-San Bernardino-Ontario, California (median: 4.4%) (Table 65). Among selected counties, the estimated prevalence ranged from 1.5% in New York County, New York (95% CI = 0.2%--2.8%) and Harris County, Texas (95% CI = 0.4%--2.6%) to 9.7% (95% CI = 4.7%--14.7%) in Berkeley County, South Carolina (median: 4.0%) (Table 66). DiscussionThe findings in this report indicate variations in the estimated prevalence of health-risk behaviors, chronic diseases, and use of preventive screening practices among U.S. adults at the state and territory, MMSA, and county level. These variations might reflect differences in the demographic factors of respondents, including age, race, and sex distribution of the population; socioeconomic conditions; availability and access to health-care services; state and local ordinances, and patterns of reimbursement for preventive services. The results provided in this report were estimated on the basis of survey results and might be different than those derived by other methods. Multiple methods are available to estimate prevalence at the local level. State and local public health authorities can use BRFSS data to plan, direct, implement, and monitor the effectiveness of intervention strategies to reduce morbidity and mortality. Healthy People 2010 objectives have been established for certain health behaviors (3). The data presented in this report can be compared with these goals to measure progress toward meeting the national objectives (Table 67). The comparisons are a general assessment because many states have established their own public health goals for 2010 that utilize various data sources. Health IndicatorsAlthough health status is measured using a single question, this concept is complex and has been demonstrated to predict both mortality and clinical events (7,8). In 2006, the proportion of adults who reported fair or poor health varied from 5.1% in Douglas County, Colorado to 32.9% in Puerto Rico. Because health insurance coverage is strongly associated with access to preventive care, lack of health insurance often leads to adverse health outcomes (9). The Healthy People 2010 objective for health insurance coverage (objective no. 1-1) is 100%; no state and territory, MMSA, or county achieved this goal in 2006. According to BRFSS weighted estimates for 2006, approximately 35 million adults in the United States do not have health insurance. Extraction of all natural teeth is considered an endpoint influenced by the incidence of dental caries and/or periodontal disease earlier in life. As is the case with other health indicators, teeth extraction is strongly associated with socioeconomic status (10). In 2006, a total of 68% of states and territories, 76% of MMSAs, and 84% of counties achieved the Healthy People 2010 objective of <22% of adults aged >65 years having lost or had all of their natural teeth extracted (objective no. 21-4). Persons with chronic diseases often experience some type of disability as their disease progresses. The estimated prevalence of disabilities that inhibit the normal activities of daily living emphasizes the need for better disease prevention and management and for better allocation of resources (11). In 2006, the proportion of adults who experienced limited activities because of physical, mental, or emotional problems ranged from 10.1% in the U.S. Virgin Islands to 35.8% in Huntington-Ashland, West Virginia-Kentucky-Ohio. Preventive PracticesChronic diseases such as heart disease and diabetes require multifaceted interventions that address health behaviors and recommended screenings. Routine checkups in primary care settings not only provide various screenings for chronic diseases, but also present opportunities for lifestyle interventions (12). In 2006, the percent of adults who visited a doctor for a routine checkup in the past year ranged from 45.4% in Utah County, Utah to 80.9% in Providence County, Rhode Island. Adults aged >65 years are at increased risk for hospitalization and death as a result of acute respiratory illnesses caused by influenza and pneumonia, both of which can be prevented through vaccination. Vaccination coverage can be improved by providing education to the public and encouraging health-care providers to offer the pneumonia vaccine year round (13). Only one community (Howard County, Maryland) was able to achieve the Healthy People 2010 objective of >90% of adults aged >65 years receiving the influenza vaccine (objective no. 14-29a). No states and territories, MMSAs, or counties achieved the goal for pneumonia vaccination (>90%) (objective no. 14-29b). Cancer PreventionColorectal cancer is the second leading cause of cancer-related deaths; an estimated 50%--60% of these deaths could be prevented if all persons aged >50 years were screened as recommended (14). The Healthy People 2010 objective for persons aged >50 years who had ever received a sigmoidoscopy was 50% (objective no. 3-12). In 2006, approximately 95% of state/territories, MMSAs, and counties accomplished this goal. The Healthy People 2010 objective for persons aged >50 years who had a blood stool test during the preceding 2 years was 33% (objective no. 3-12); no state or territory, 15 MMSAs, and 27 counties achieved this goal. A Pap test is used to detect abnormal or cancerous cells in the cervix. Because of the increased use of the Pap test, cervical cancer incidence and mortality have declined in the United States (15). The Healthy People 2010 objective for Pap test screening during the preceding 3 years for women aged >18 years is 90% (objective no. 3-11b). Although no states or territories reached this goal in 2006, approximately 15% of MMSAs and counties have achieved this goal. Breast cancer is the second leading cause of cancer deaths among women in the United States. Mammogram screenings are used to detect breast cancer early, thus improving the chances of successful treatment (16). The Healthy People 2010 objective for women aged >40 years who had received a mammogram during the preceding 2 years is 70% (objective no. 3-13). Approximately 90% of states and territories, MMSAs, and counties achieved this goal in 2006. Prostate cancer is the second leading cause of cancer deaths among men in the United States. No scientific consensus exists that the PSA screening test is beneficial (17). In 2006, the estimated proportion of men aged >40 years who had a PSA test during the preceding 2 years ranged from 39.5% in San Francisco-Oakland-Fremont, California to 71.7% in Ocean County, New Jersey. Health Risk BehaviorsCigarette smoking is the single most preventable cause of morbidity and mortality in the United States (18).The list of diseases caused by cigarette smoking has expanded to include numerous types of cancers, several cardiovascular and respiratory diseases, reproductive effects, cataracts, and low bone density (18). Health consequences of secondhand smoke include pediatric respiratory problems, CHD, and lung cancer in adults (19). The Healthy People 2010 objective for smoking is <12% (objective no. 27-1a) and was achieved by two states, one territory, six MMSAs, and 12 counties in 2006. Binge drinking might cause impulsive behavior that can lead to risky sexual activity, injuries, and suicide (20,21). Binge drinking over a long period of time can lead to cirrhosis of the liver and other chronic conditions (22). In 2006, a total of 13 states and territories and approximately 30% of MMSAs and counties achieved the Healthy People 2010 objective of <13.4% of adults reporting binge drinking (objective no. 26-11c). Physical activity is beneficial for adults of all ages and is associated with improved health-related quality of life (23). Certain individual and societal barriers might prevent participation in the recommended level of physical activity. To improve this situation, communities must work to encourage a more active lifestyle (24). The Healthy People 2010 objective for prevalence of no leisure time physical activity is <20% (objective no. 22-1) and was achieved by approximately 20% of states and territories and over 35% of MMSAs and counties in 2006. Seat belt use in the United States has risen substantially during the preceding three decades and illustrates how public policy can be successful in changing behavior. Laws and types of enforcement vary by state and studies have shown that increased spending on police and safety programs enhances seat belt use (25). Although no states and territories met the Healthy People 2010 objective of 92% for seat belt use (objective no. 15-19) in 2006, a total of 11 MMSAs and 17 counties reached the goal. Chronic DiseasesObesity increases the risk for developing serious chronic diseases. The problem involves a complex interaction of lifestyle patterns and calls for pervasive intervention programs at the community level (26). Among selected counties, the estimated prevalence among adults >18 years who were overweight ranged from 23.6% to 48.7% and the estimated prevalence of obesity ranged from 9.8% to 45.5% (obesity prevalence is calculated for adults aged >20 years to match with Healthy People 2010 objectives). The Healthy People 2010 objective for obesity (<15%) was achieved by no states and territories, two MMSAs, and five counties in 2006 (objective no. 19-2). Asthma is a chronic condition that can be life-threatening if not properly treated. Asthma in U.S. adults accounted for an estimated 14.5 million lost work days in 2004, and prescription drugs cost approximately $6 billion annually (27). In 2006, the estimated current asthma prevalence among persons aged >18 years ranged from 3.0% in Somerset County, New Jersey to 13.8% in Lorain County, Ohio. Adults who have received a diagnosis of diabetes are at risk for developing various complications, including heart disease, stroke, blindness, and kidney disease. These complications can be prevented by controlling blood glucose levels and receiving proper preventive care (28). In 2006, the estimated diabetes prevalence among persons aged >18 years ranged from 2.4% in Summit County, Utah to 12.9% in Gaston County, North Carolina. Cardiovascular DiseaseCHD can lead to a heart attack and might eventually cause heart failure. Angina or chest pain is the most common symptom of CHD. The prevention and treatment of CHD is complex and widely studied; common risk factors such as high cholesterol, physical inactivity, and smoking typically are addressed (29). In 2006, the estimated prevalence of CHD among persons aged >45 years ranged from 5.2% in the U.S. Virgin Islands to 21.6% in Huntington-Ashland, West Virginia--Kentucky--Ohio. Stroke is the third leading cause of death in the United States and is the leading cause of serious long-term disability. Stroke mortality rates are higher among blacks compared with whites, and the southeastern United States has the highest stroke death rate in the country (30). Among states and territories, the estimated prevalence among persons aged >45 years with a history of stroke ranged from 3.0% in Puerto Rico to 7.7% in Alabama. LimitationsThe findings in this report are subject to several limitations. First, only households with land-line telephones are included in the survey sample; cell phone--only households and households without telephones are excluded. Response rates continue to decline because of changes in telecommunication usage (e.g., increases in the number of cell-phone only households and telephone number portability). CDC is monitoring the effect of changes in telecommunication usage by conducting research on sampling cell-phone numbers, sending prenotification letters, reaching respondents that speak languages other than English and Spanish, and multiple-mode data-collection techniques. Second, BRFSS data are self-reported and are subject to recall bias and social desirability effects. Despite these limitations, BRFSS data have been demonstrated to provide valid and reliable estimates when compared with national household surveys in the United States (31,32). BRFSS is a cost-effective and timely method for collecting state and local data, and often is the only data source available to communities to assess local health conditions and track progress. ConclusionThe findings in this report indicate the need to strengthen efforts in health promotion and disease prevention programs and policies. BRFSS data are used at the state and local level to renew and maintain efforts to prevent the leading causes of morbidity and mortality in the United States and to monitor progress trends toward achieving Healthy People 2010 objectives. References
2006 Behavioral Risk Factor Surveillance System State and Territory Project CoordinatorsAlabama, Jesse Pevear III, MSPH; Alaska, Rebecca Wells; Arizona, Brian Bender; Arkansas, LaTonya Bynum; California, Marta Induni, PhD; Colorado, Rickey Tolliver, MPH; Connecticut, Diane Aye, PhD; Delaware, Fred Breukelman; District of Columbia, Tracy Garner; Florida, Melissa Murray, MS; Georgia, Leah Bryan, MPH; Guam, William Brandshagen; Hawaii, Florentina Reyes-Salvail, MS; Idaho, Teresa Abbott; Illinois, Bruce Steiner, MS; Indiana, Linda Stemnock; Iowa, Donald Shepherd, PhD; Kansas, Farooq Ghouri, MBBS, MPH; Kentucky, Tracey Sparks; Louisiana, Todd Griffin, MSPH; Maine, Kip Neale; Maryland, Helio Lopez, MS; Massachusetts, Bruce Cohen, PhD; Michigan, Ann Rafferty, PhD; Minnesota, Nagi Salem, PhD; Mississippi, Ron McAnally; Missouri, Janet Wilson, MEd, MPA; Montana, Susan Cummings; Nebraska, Larry Andelt, PhD; Nevada, Alicia Hansen, MS; New Hampshire, Susan Knight, MSPH; New Jersey, Kenneth O'Dowd, PhD; New Mexico, Wayne Honey, MPH; New York, Colleen Baker; North Carolina, Bob Woldman, MA; North Dakota, Melissa Parsons; Ohio, Patricia Coss; Oklahoma, Derek Pate, MPH; Oregon, Renee Boyd; Pennsylvania, Robert Dewar; Puerto Rico, Ruby Serrano-Rodriguez, DrPh; Rhode Island, Jana Hesser, PhD; South Carolina, Kristen Helms, MSPH; South Dakota, Mark Gildemaster; Tennessee, David Ridings; Texas, Michelle Cook, MPH; Utah, Jennifer Wrathall, MPH; Vermont, Rodney McCormick, PhD; U.S. Virgin Islands, Sharon Williams, MS; Virginia, Susan Spain; Washington, Katrina Wynkoop-Simmons, PhD; West Virginia, Fred King; Wisconsin, Anne Ziege, PhD; Wyoming, Menlo Futa, MA.
2006 Behavioral Risk Factor Surveillance System Team Ali Mokdad, PhD; Suzianne Garner, MPA, Lina Balluz, ScD, Earl Ford, MD, Ruth Jiles, PhD, Jody Hill, Annie Bragg, Indu Ahluwalia, PhD, Julie Brown, Gloria Colclough, Satvinger Dhingra, Amy Fan, MD, PhD, William Garvin, Tod Hebenton, Meaghan Elizabeth House, Shaohua Hu, DrPH, MD, Ram Jain, PhD, Kenneth Laliberte, MPA, Chaoyang Li, PhD, MD, Virginie Mallawaarachchi, PhD, Shravani Reddy Muppidi, Catherine Okoro, MS, William Pearson, PhD, Mohamed Qayad, PhD, Henry Roberts, PhD, James Ribble, Tara Strine, MPH, Machell Town, MS, Judith Wellen, MHS, Guixiang Zhao, MD, PhD, Bill Bartoli, MSc, Farah Chowdhury, MBBS, MPH, Pranesh Chowdhury, MPH, David Gilbertz, MSc, Elizabeth Hughes, DrPH, Greta Kilmer, MS, Yan Li, MPH, Wilmon Murphy, Xiaoting Qin, PhD, Ajay Sharma, Balarami Valluru, MS, Justin Vigeant, John Wen, MD, Yuna Zhong, MD, Division of Adult and Community Health, National Center for Chronic Disease Prevention and Health Promotion, CDC. Table 1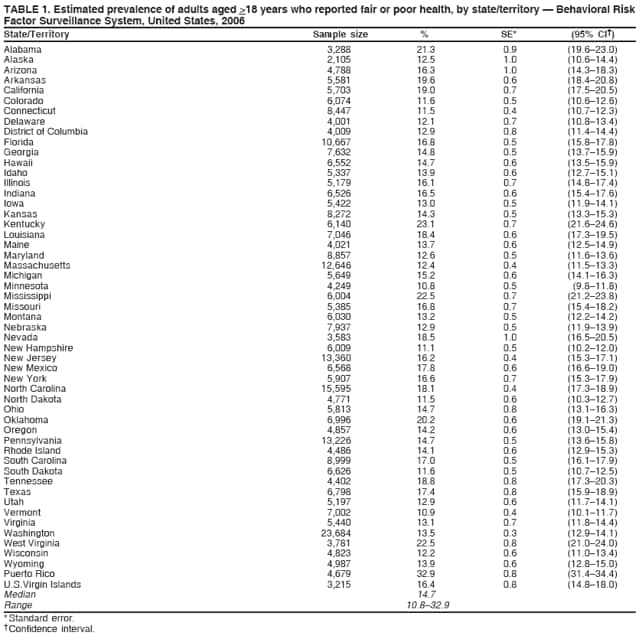 Return to top. Table 2 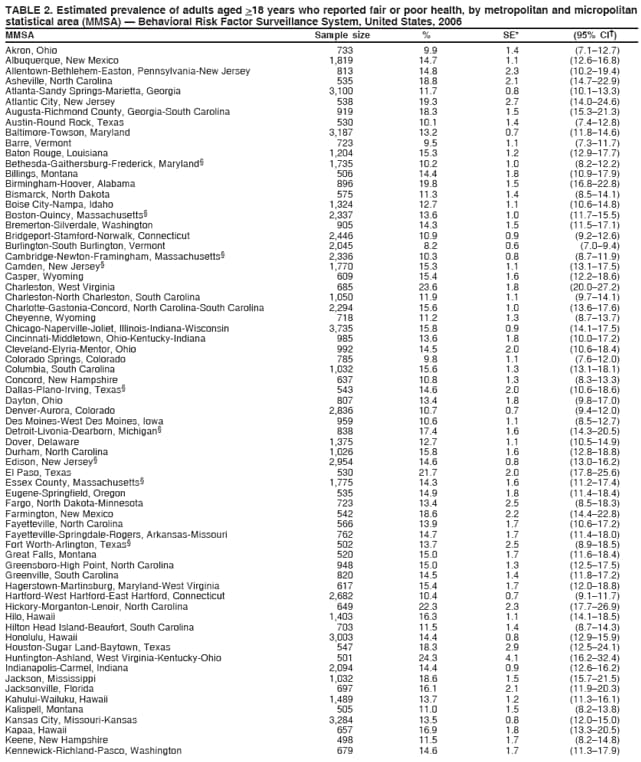 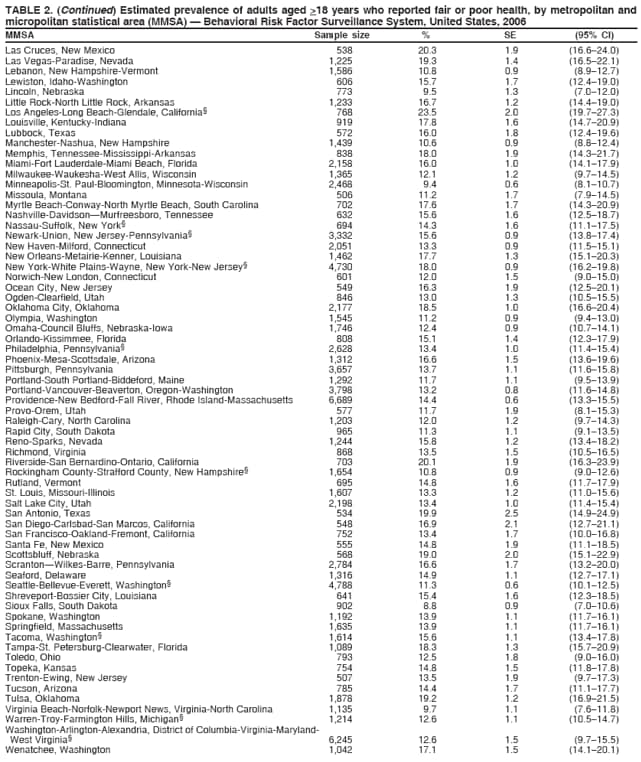  Return to top. Table 3 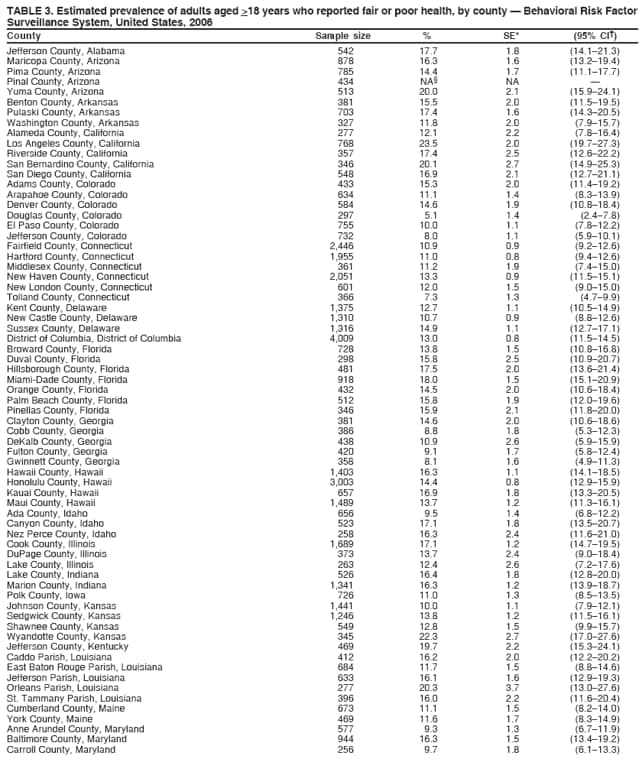 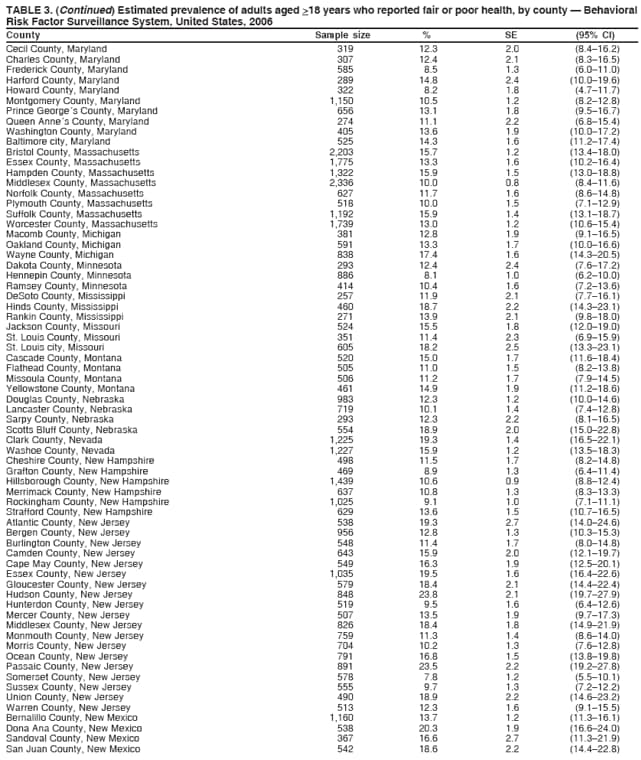 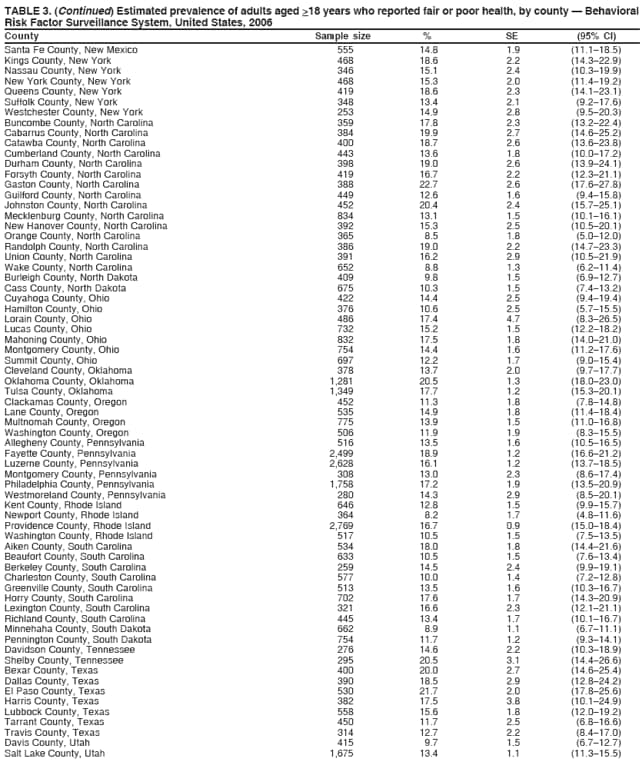 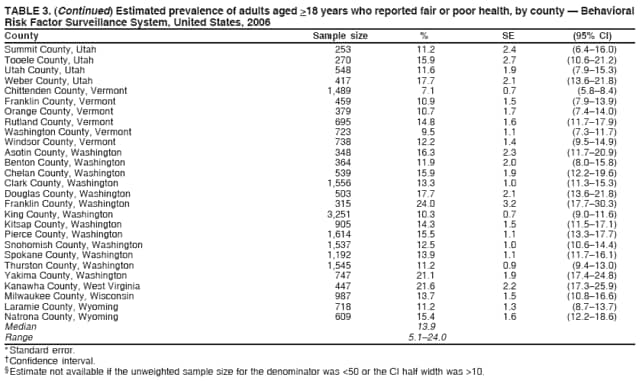 Return to top. Table 4 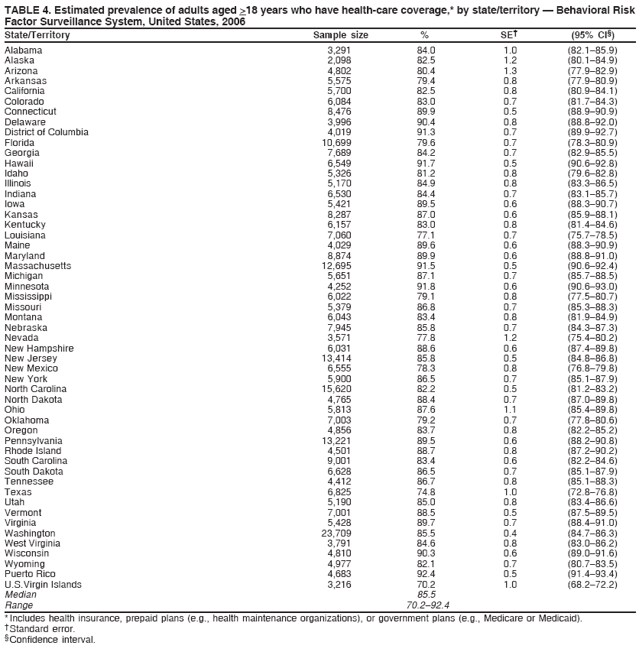 Return to top. Table 5 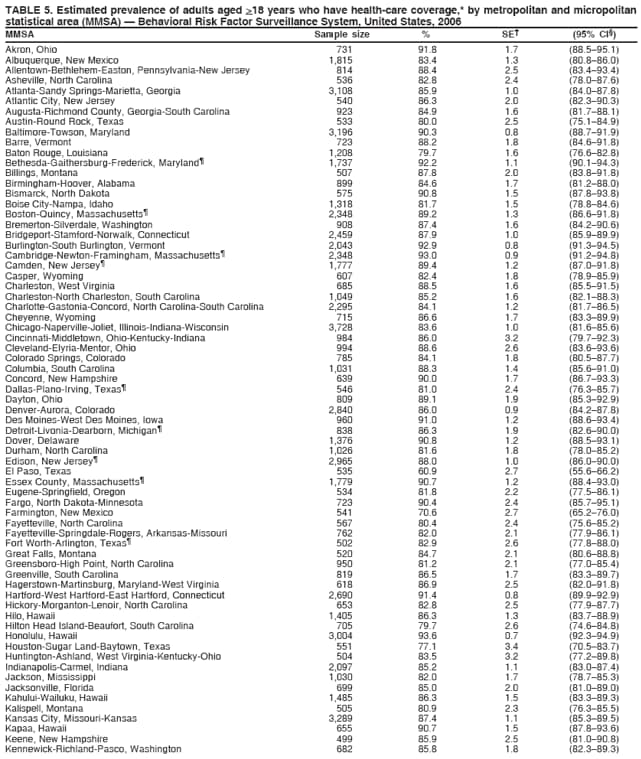 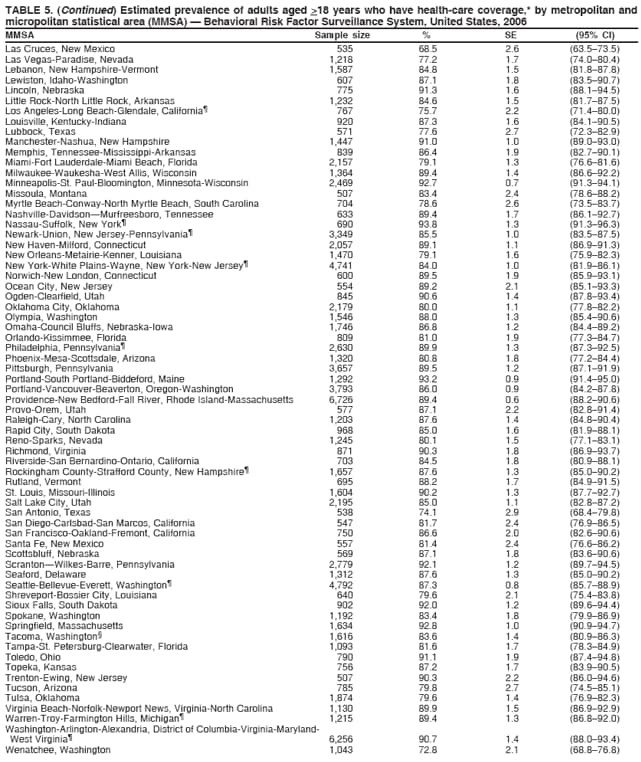  Return to top. Table 6 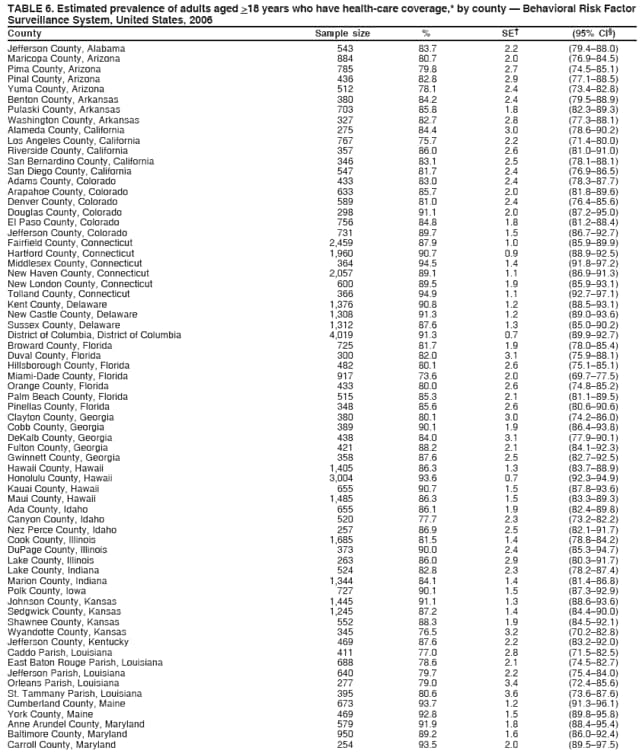 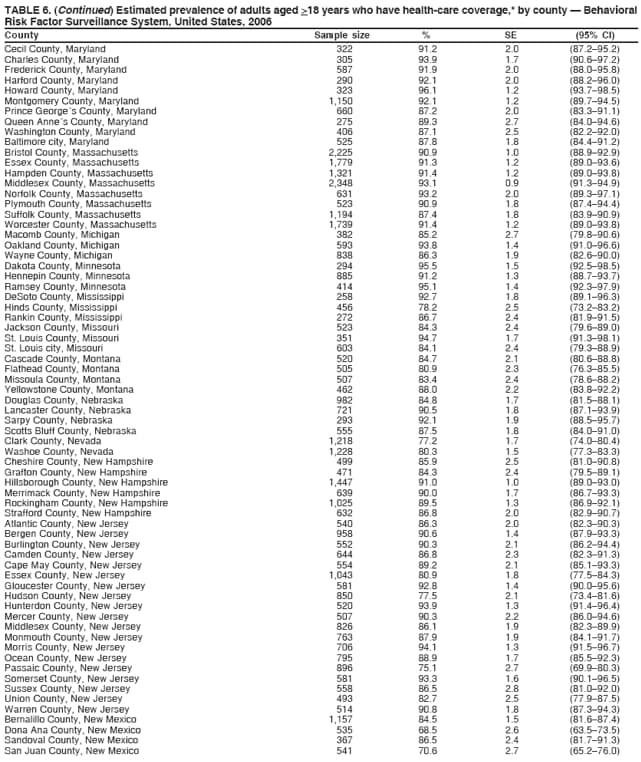 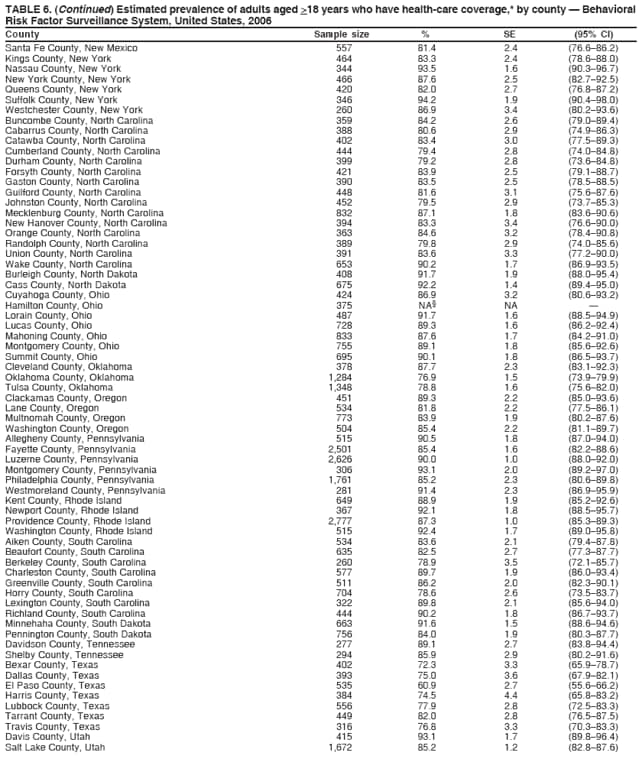 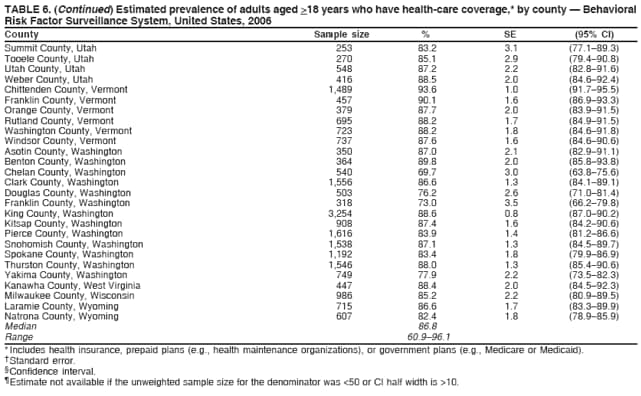 Return to top. Table 7 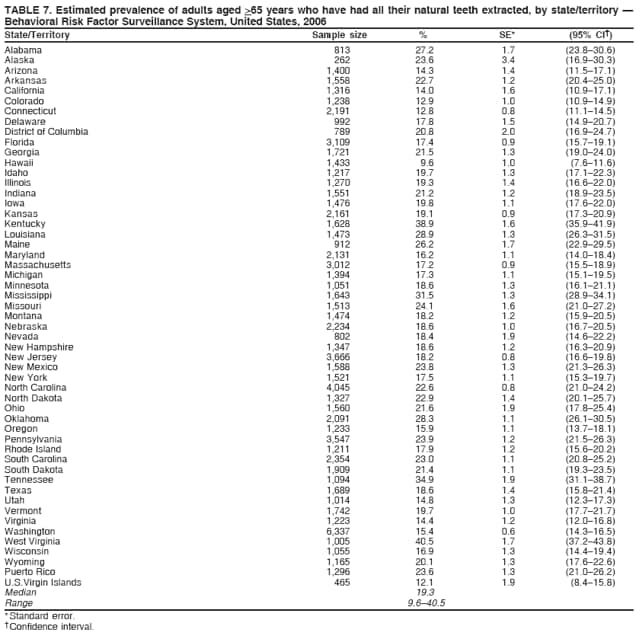 Return to top. Table 8 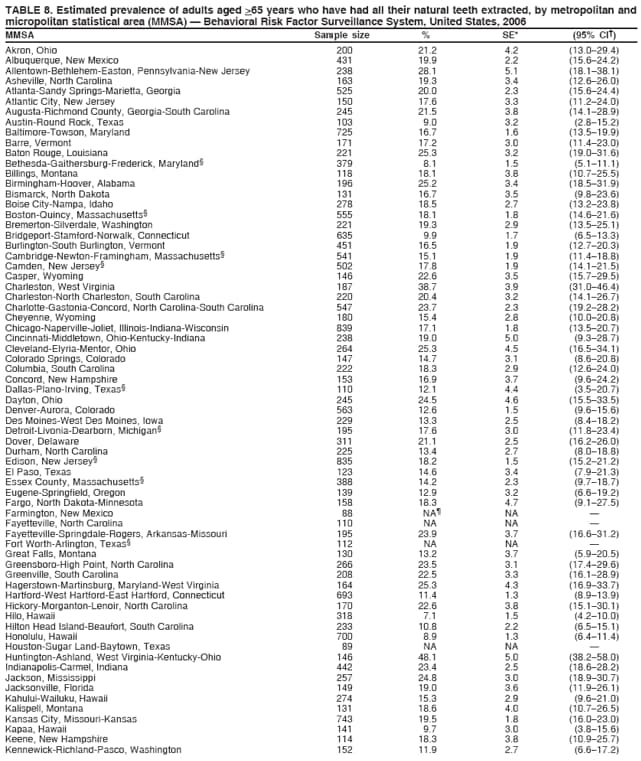 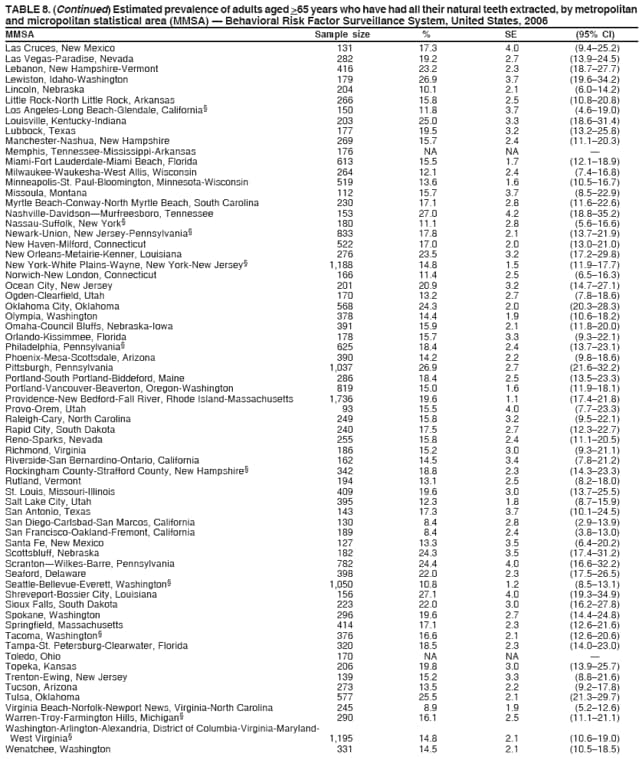  Return to top. Table 9 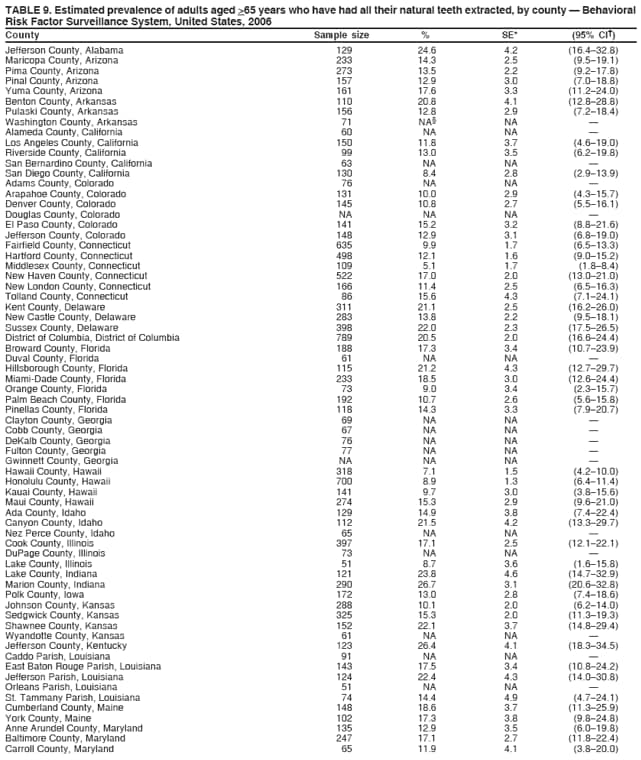 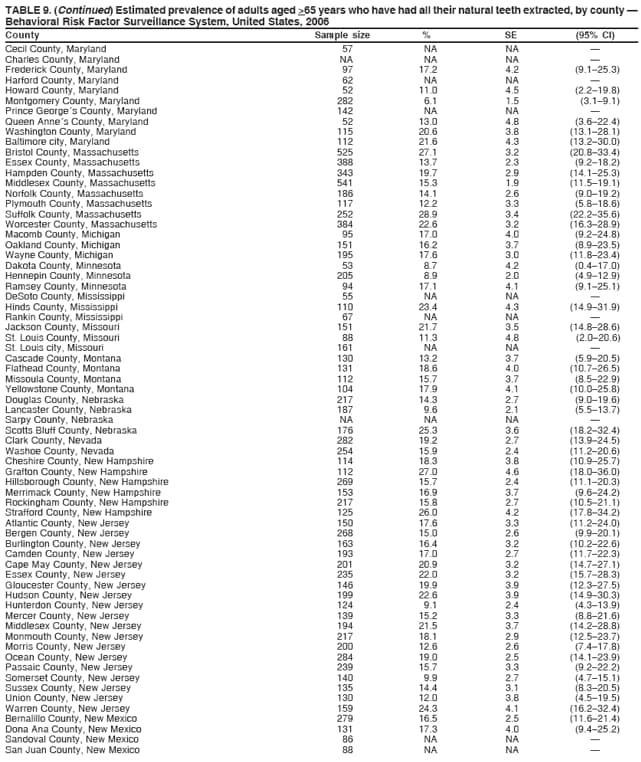 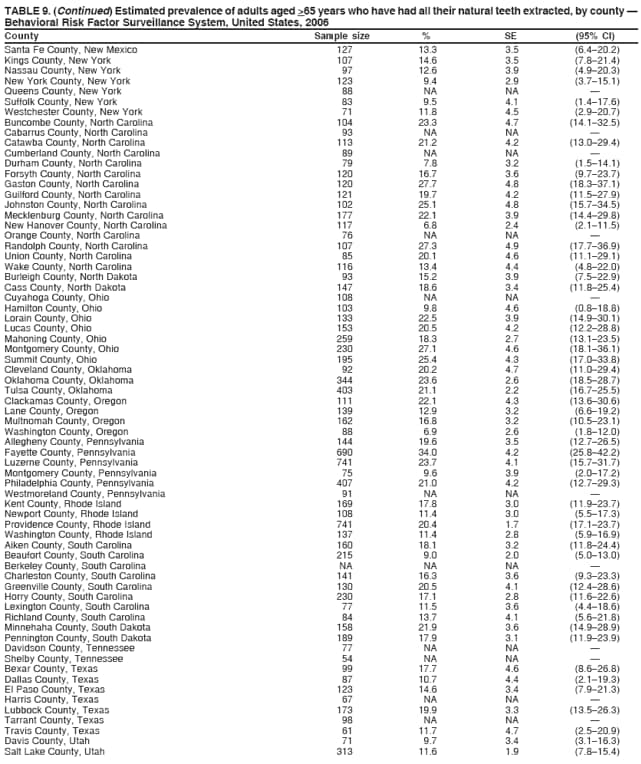 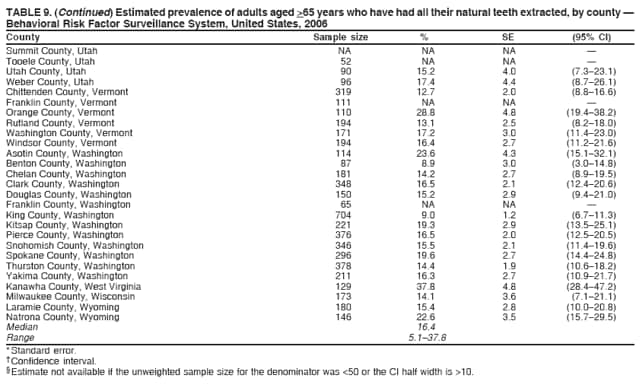 Return to top. Table 10 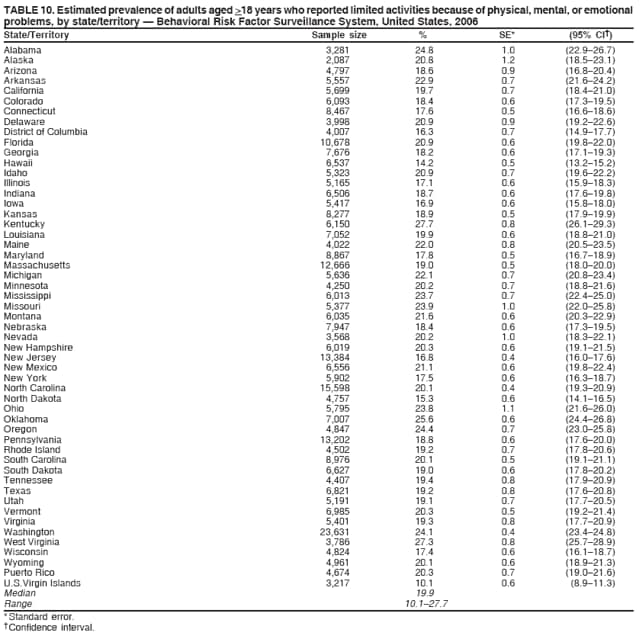 Return to top. Table 11 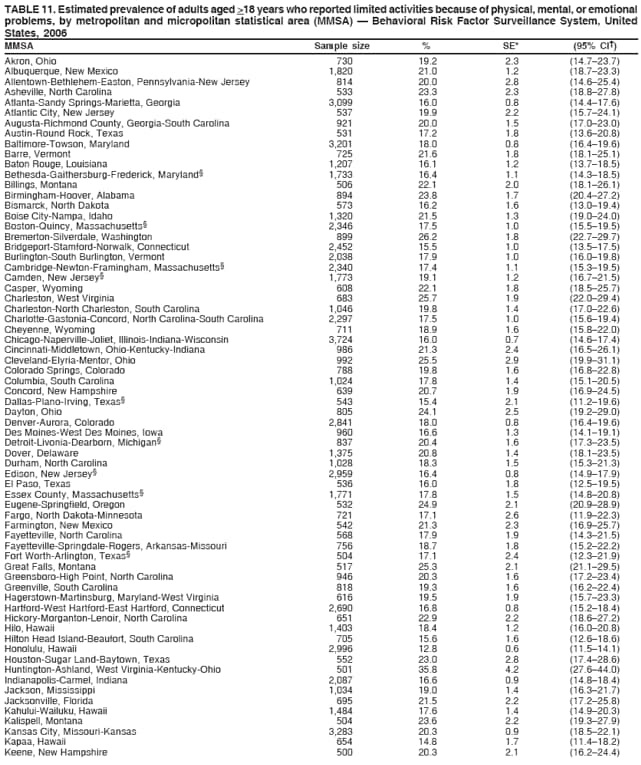 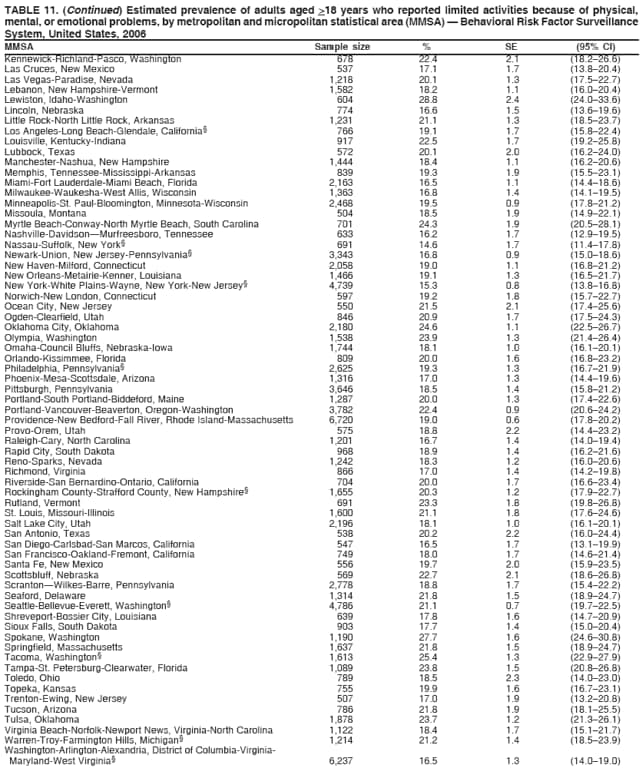  Return to top. Table 12 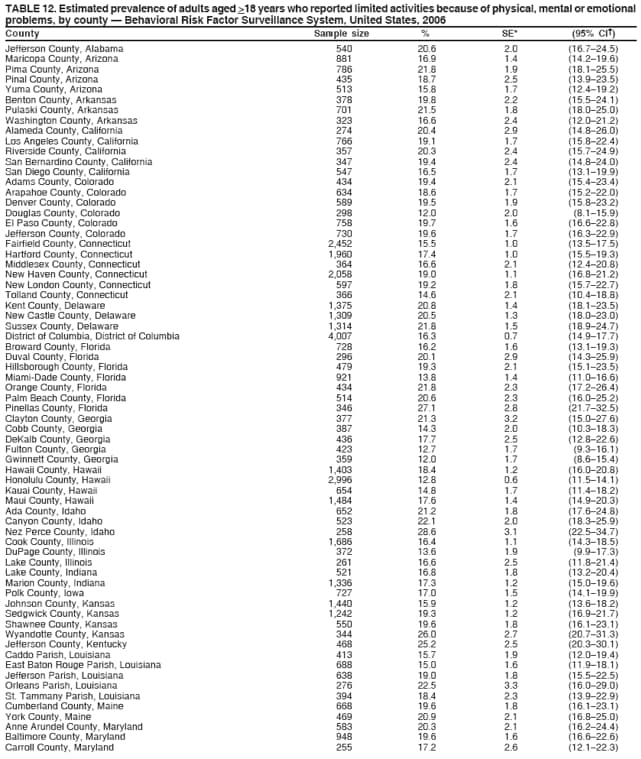 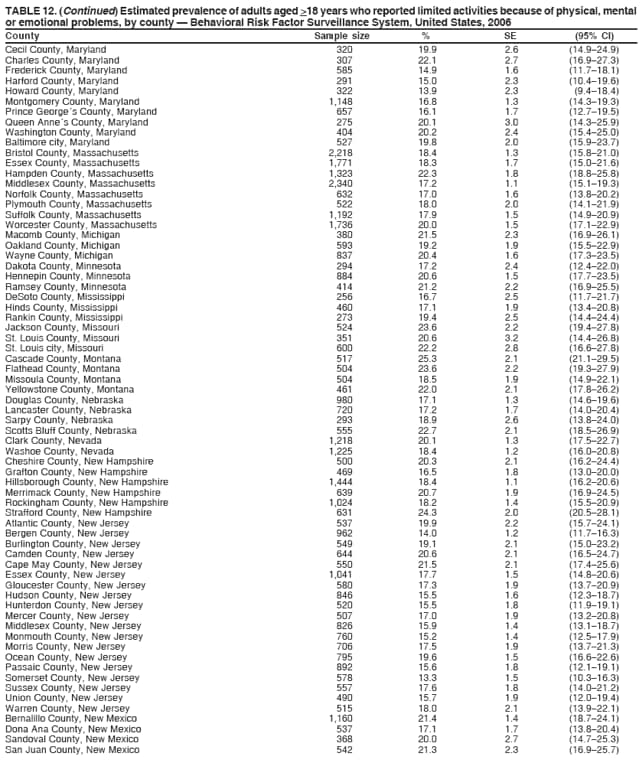 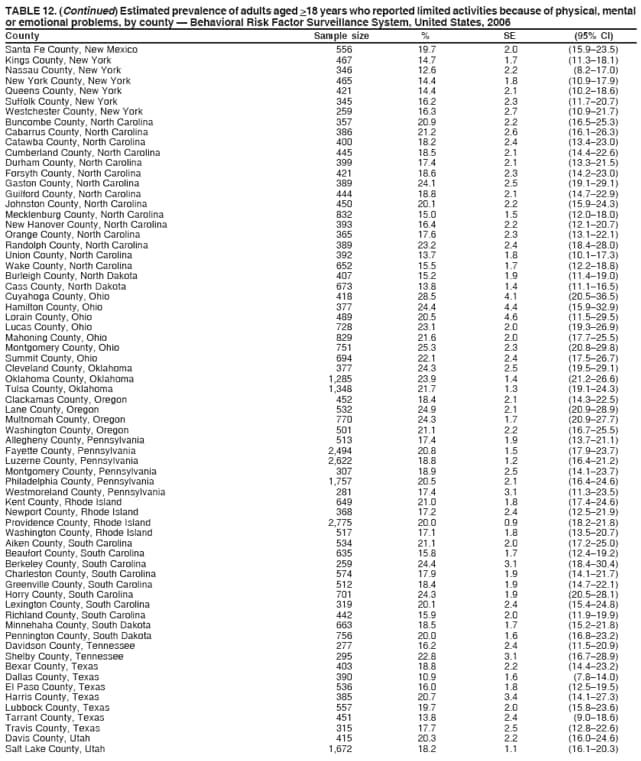 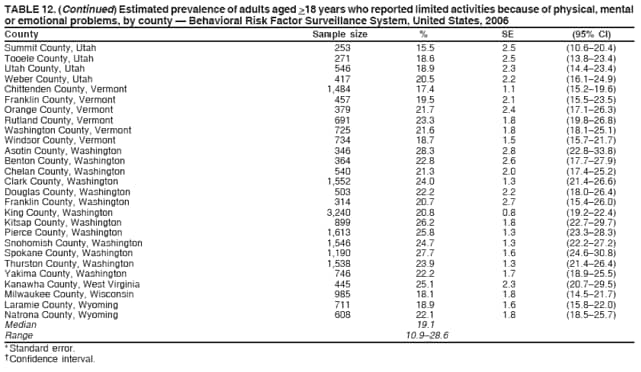 Return to top. Table 13 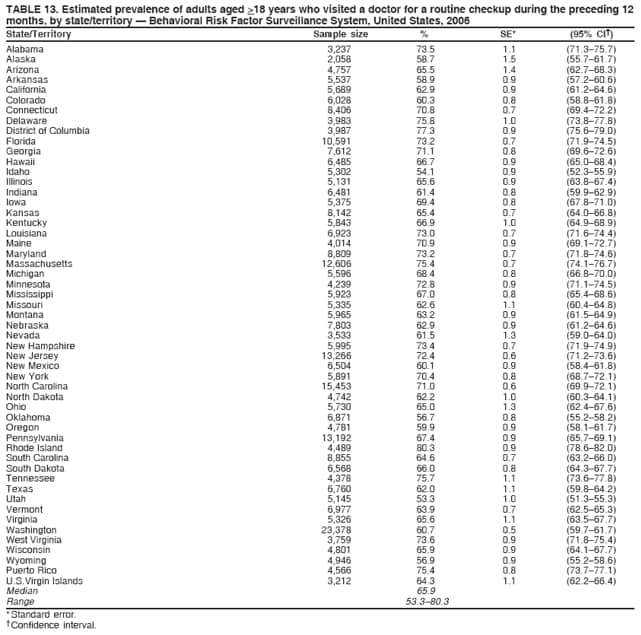 Return to top. Table 14 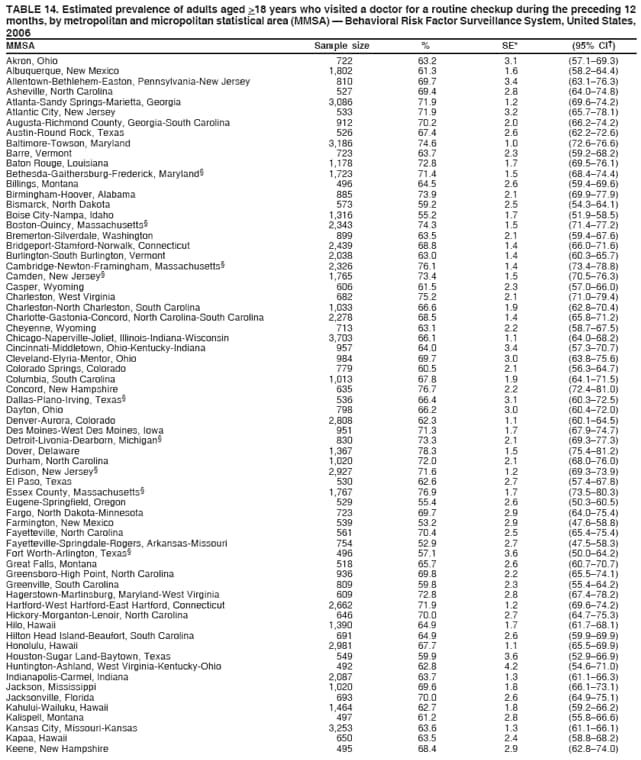 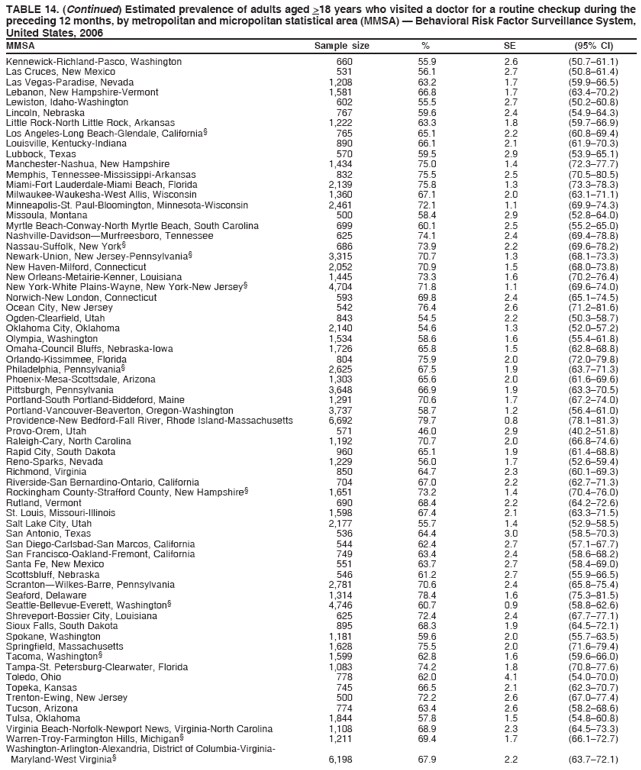  Return to top. Table 15 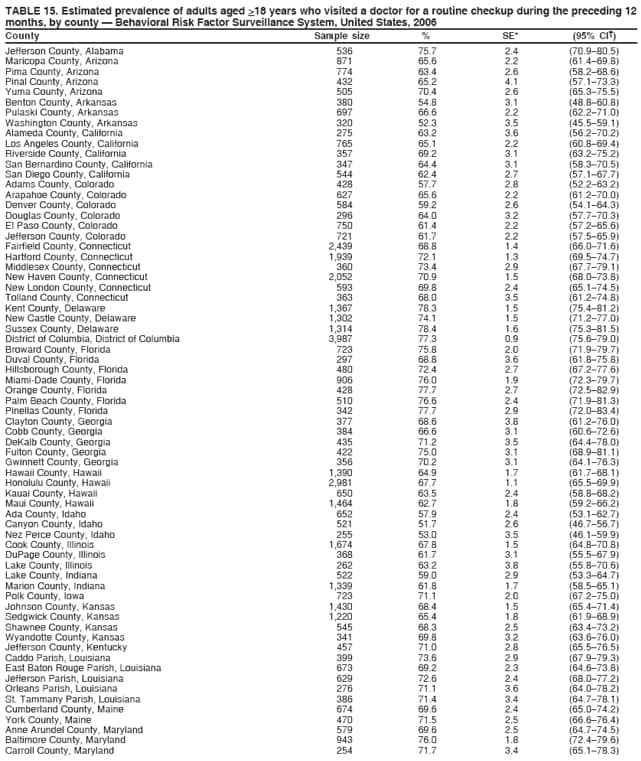 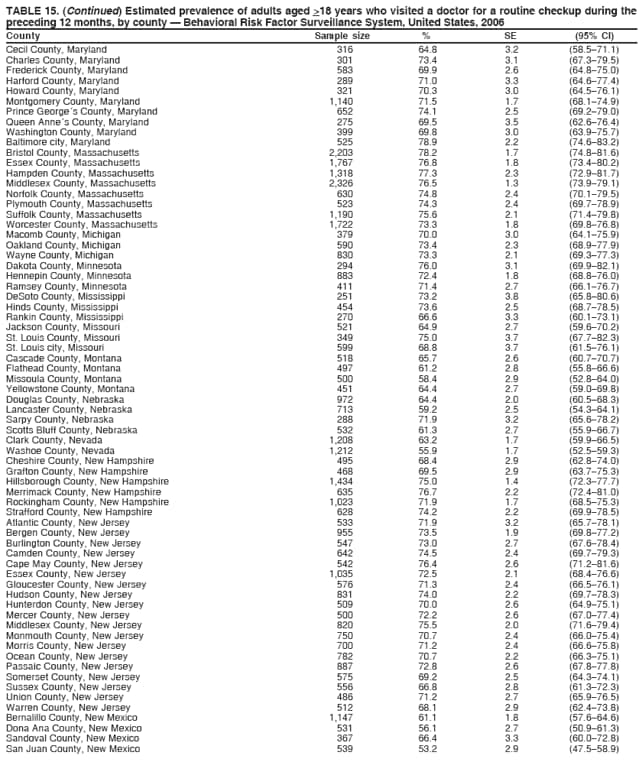 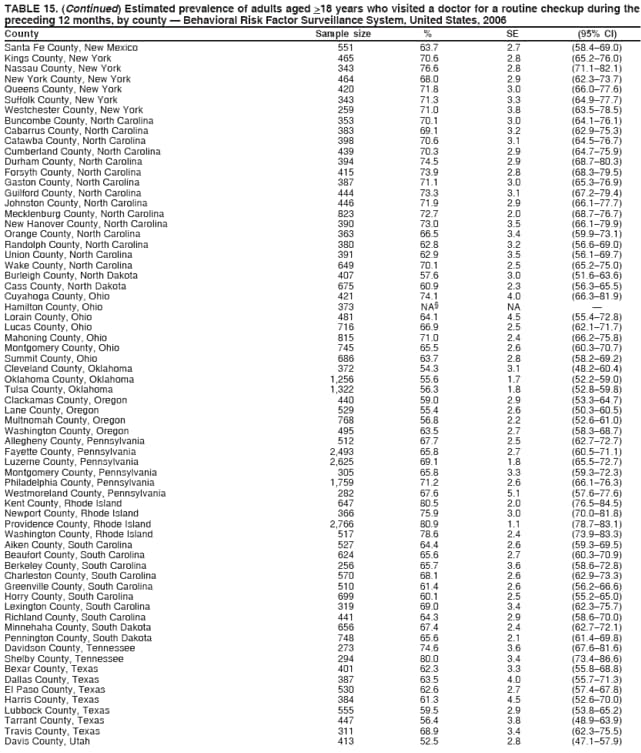 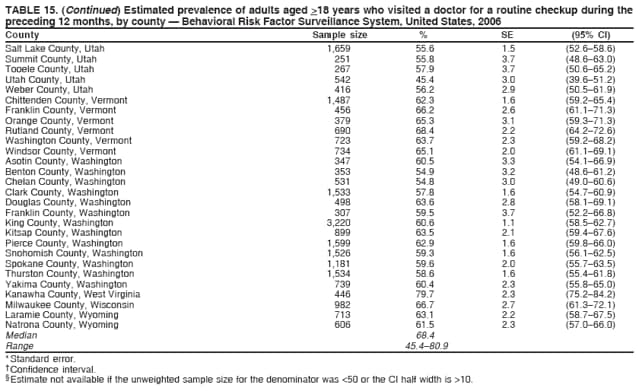 Return to top. Table 16 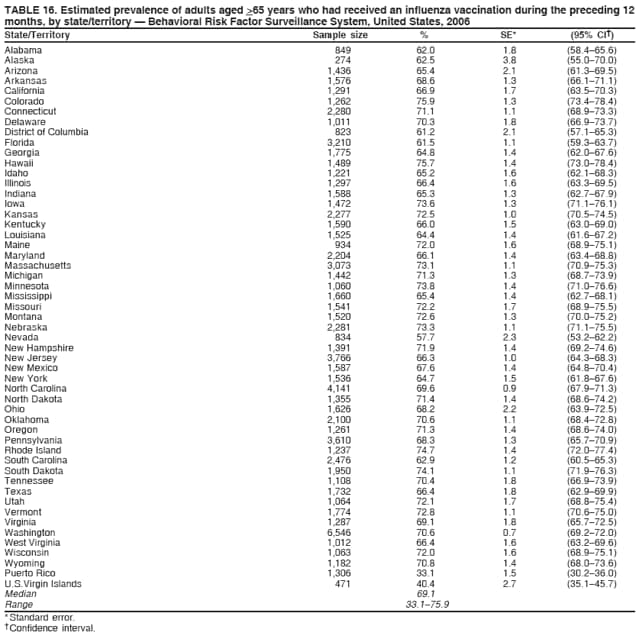 Return to top. Table 17 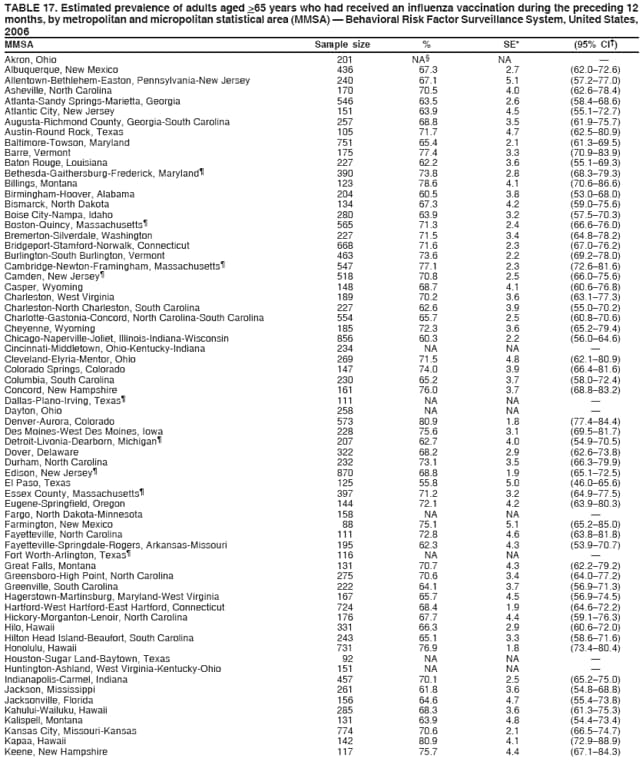 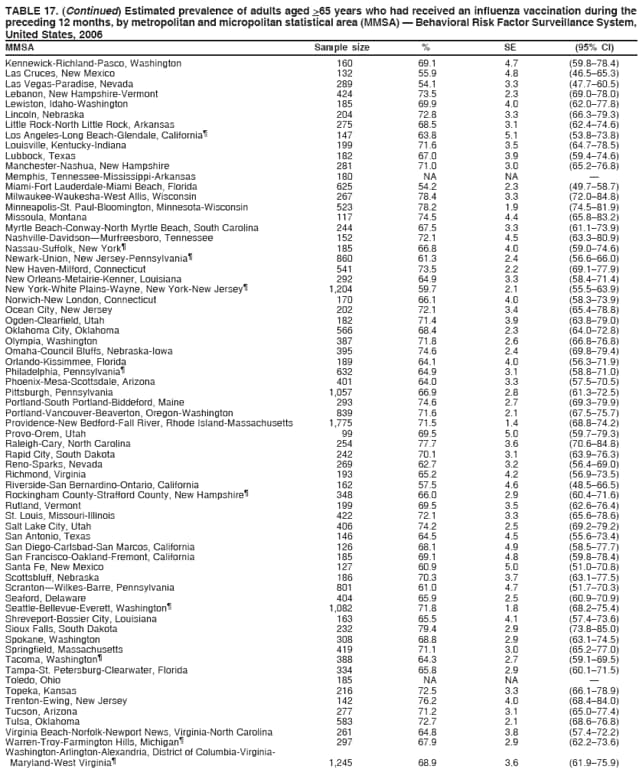 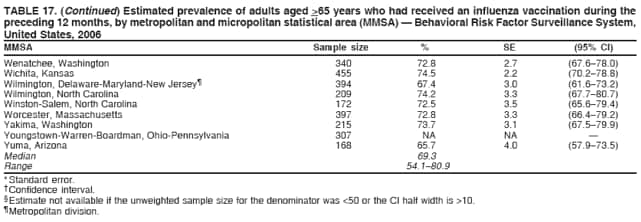 Return to top. Table 18 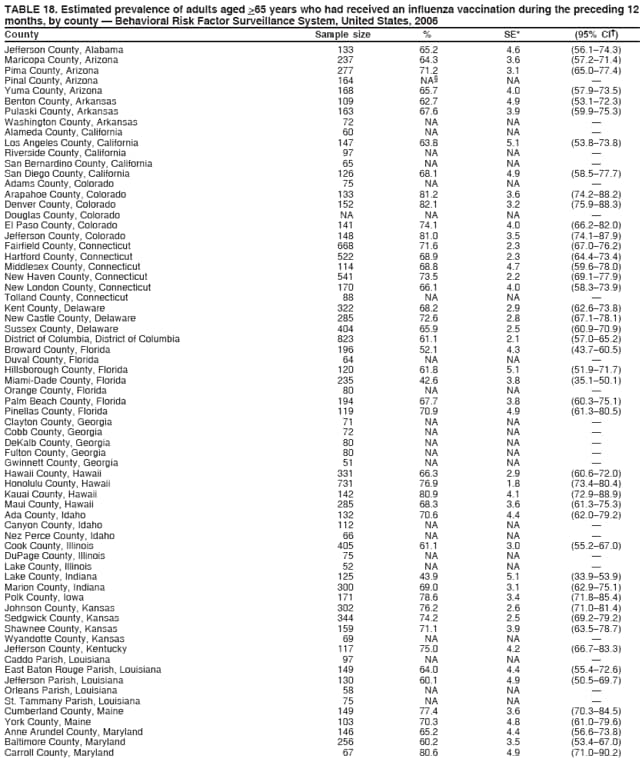 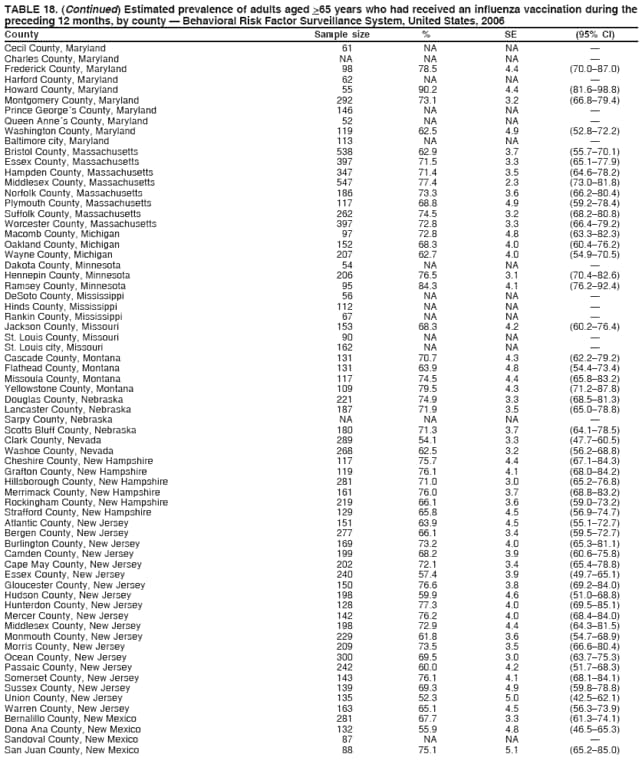 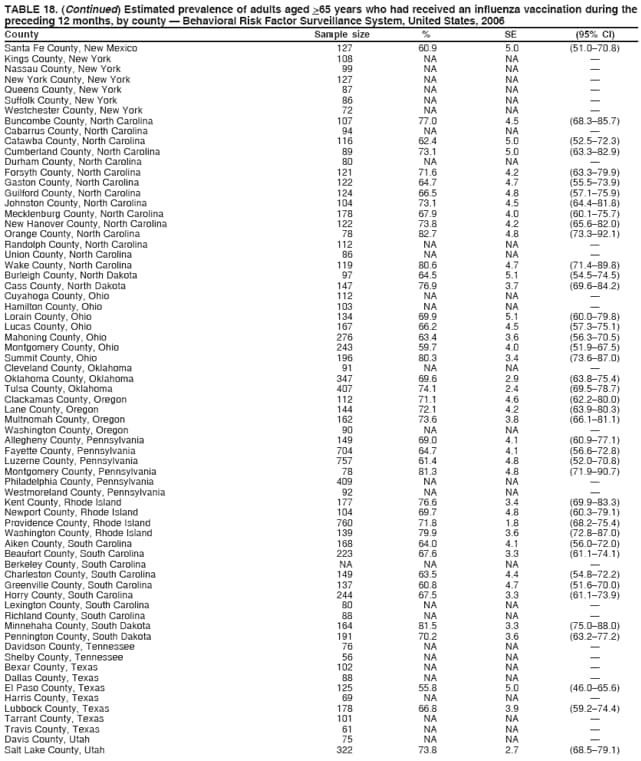 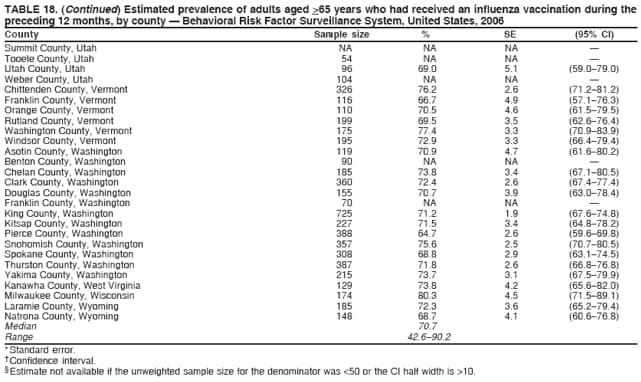 Return to top. Table 19 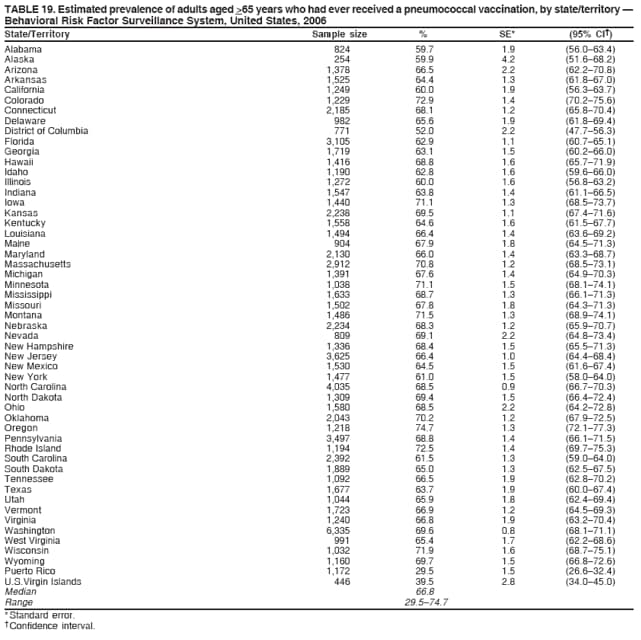 Return to top. Table 20 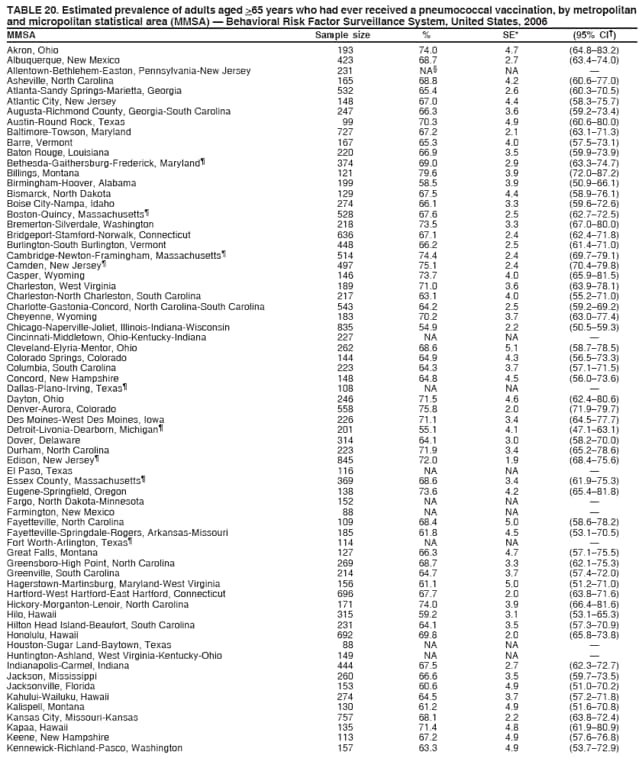 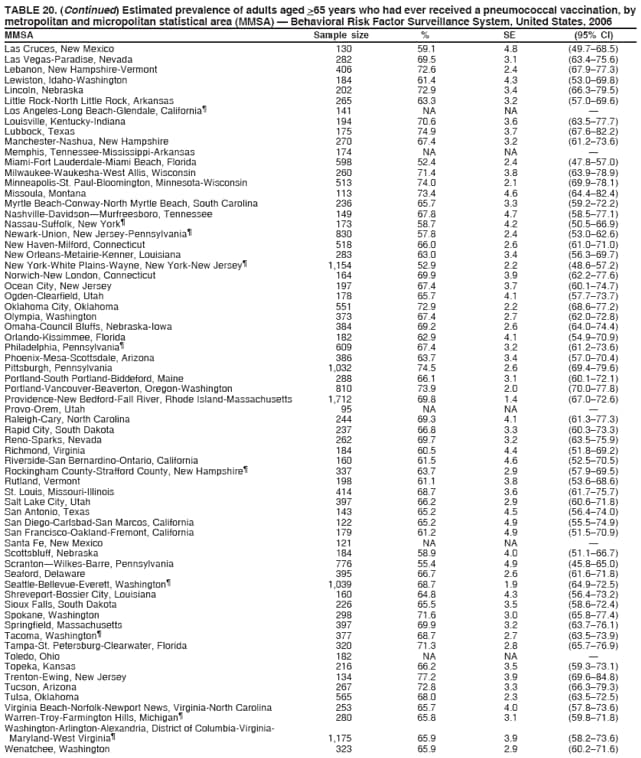  Return to top. Table 21 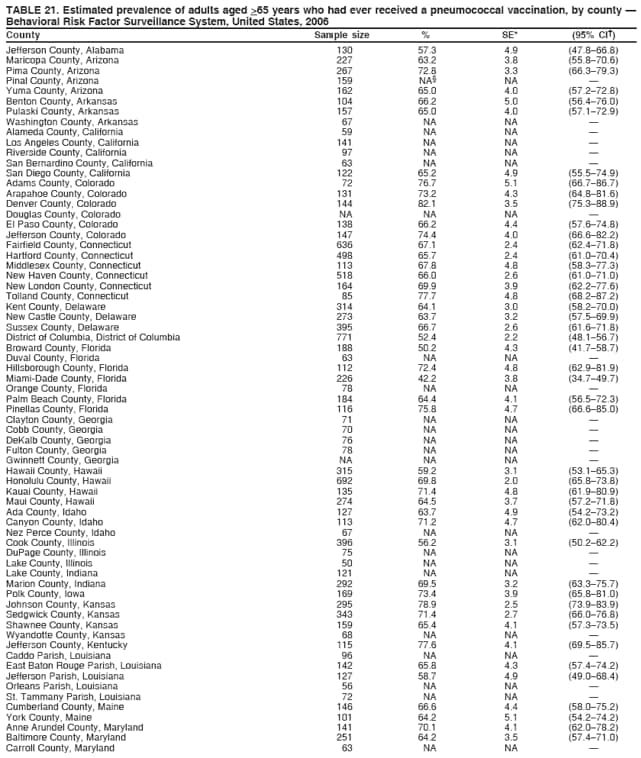 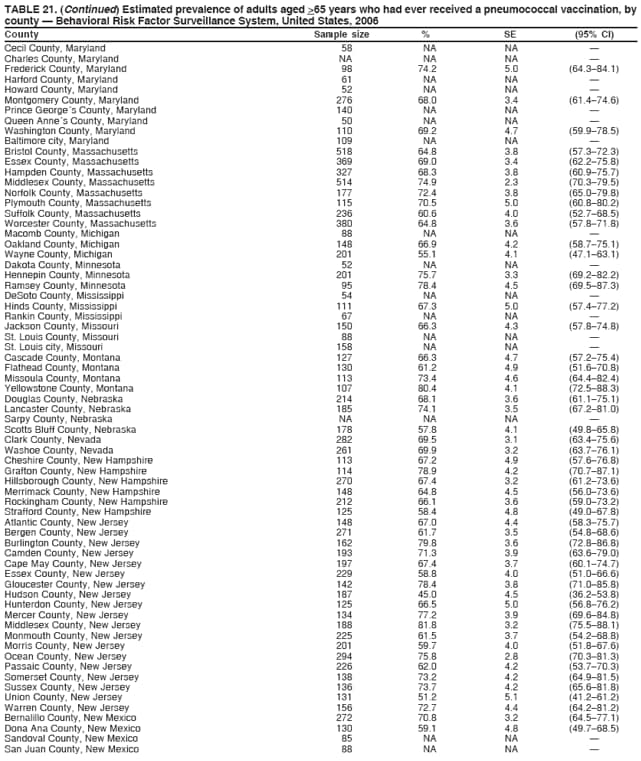 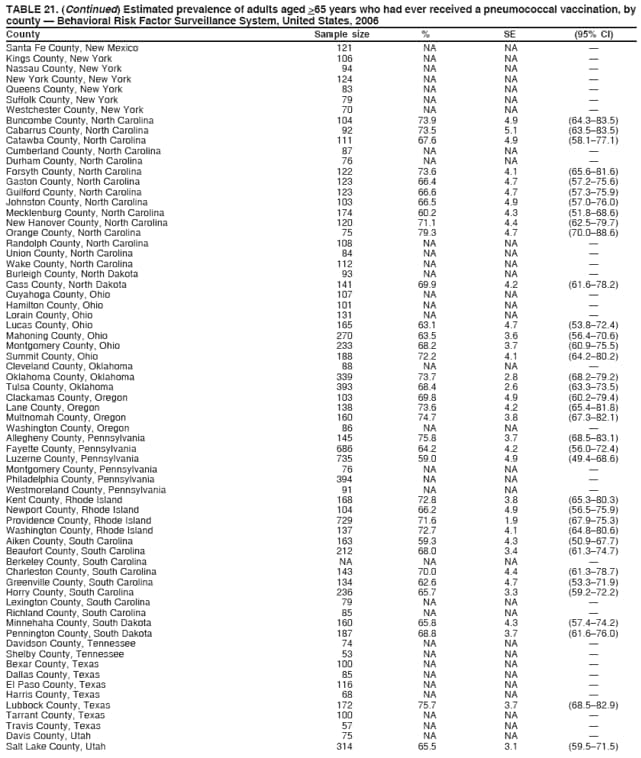 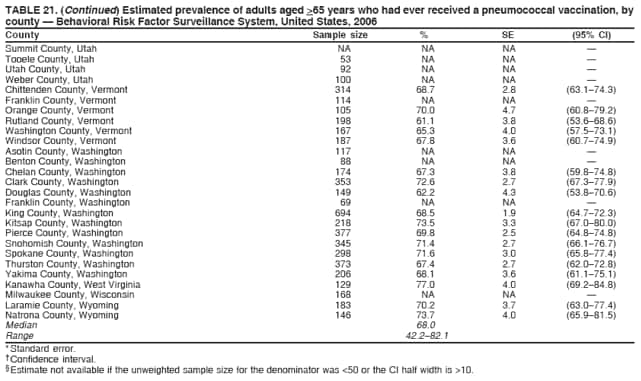 Return to top. Table 22 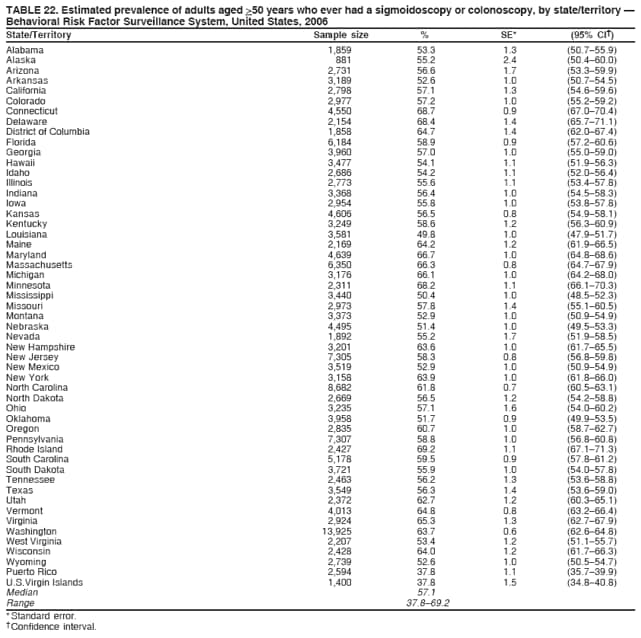 Return to top. Table 23 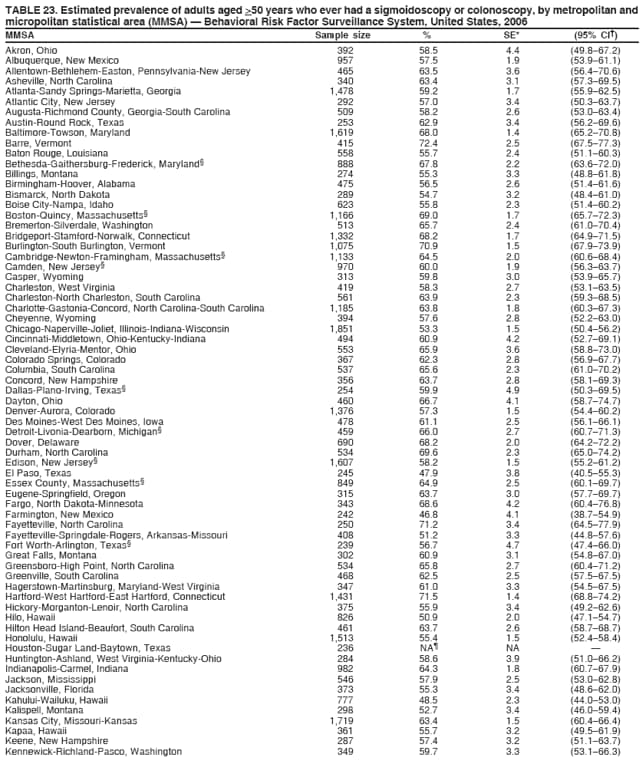 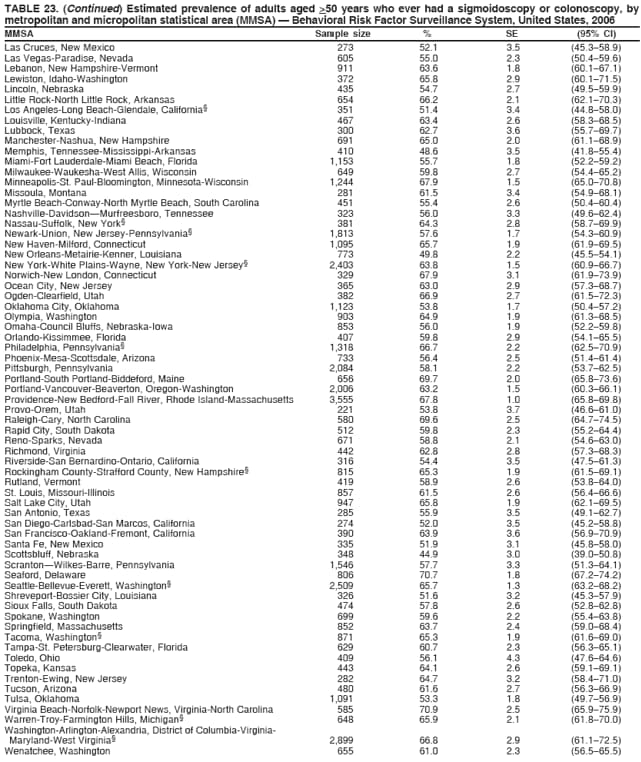  Return to top. Table 24 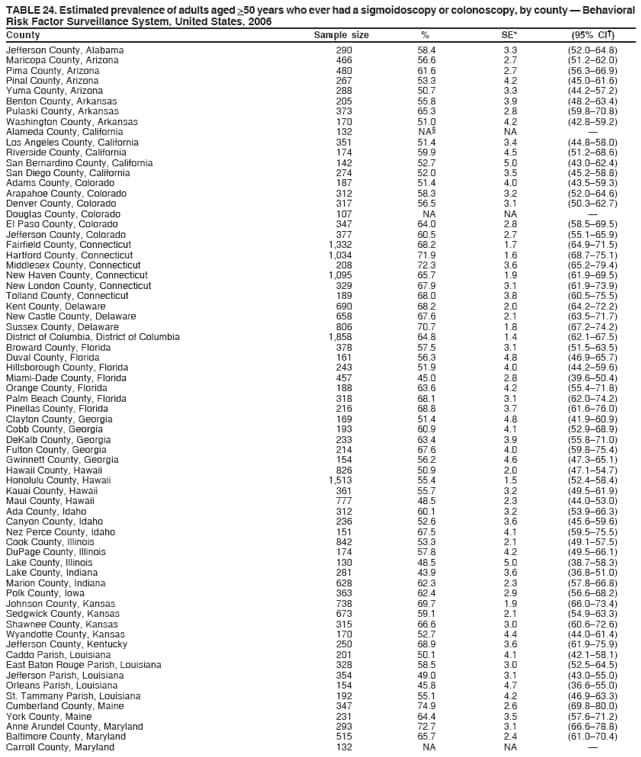 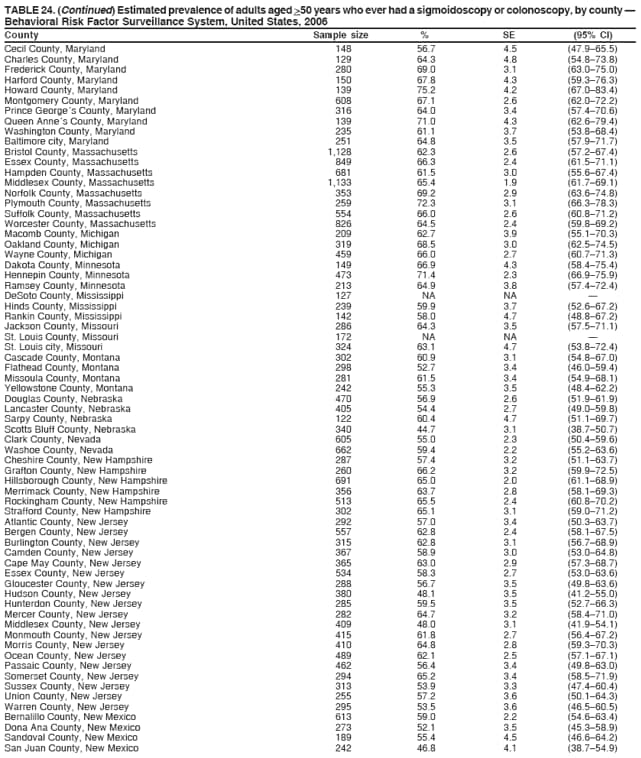 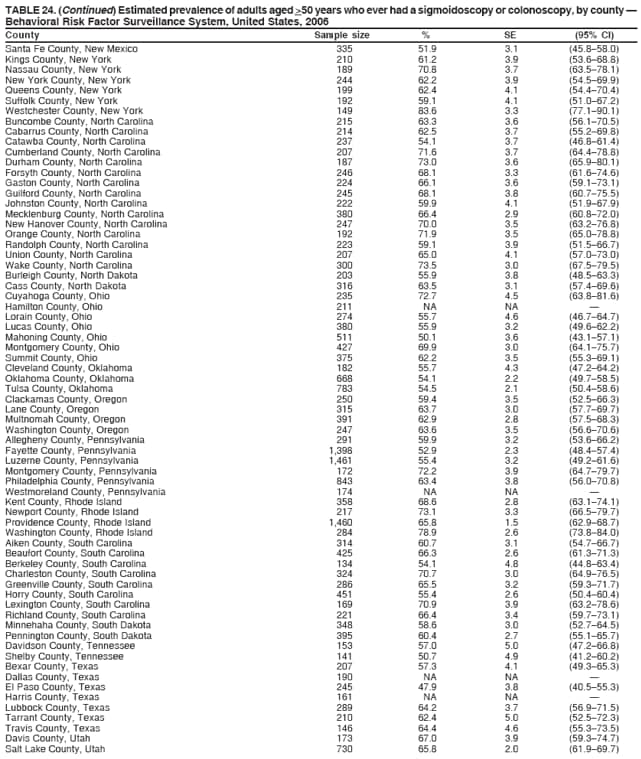 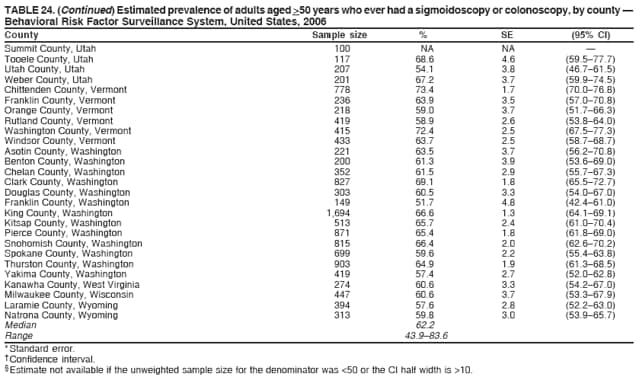 Return to top. Table 25 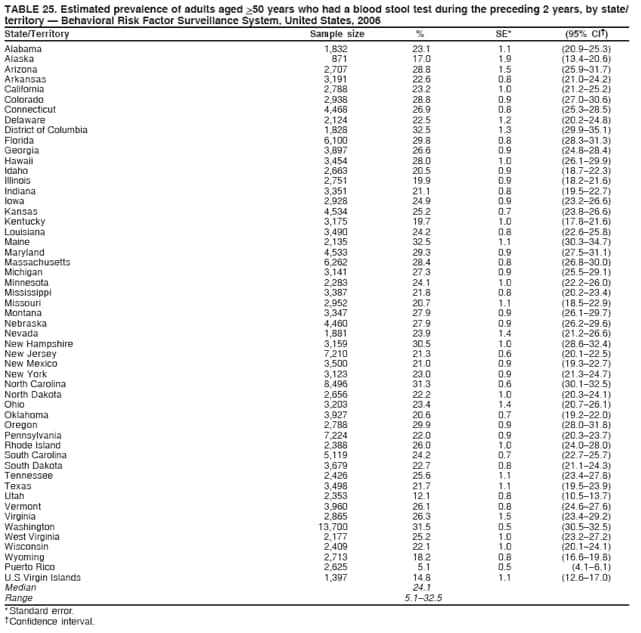 Return to top. Table 26 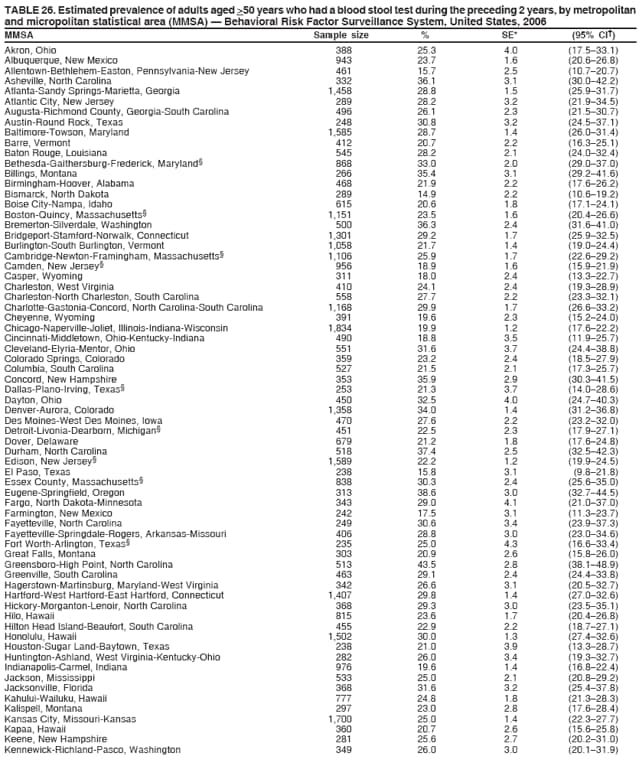 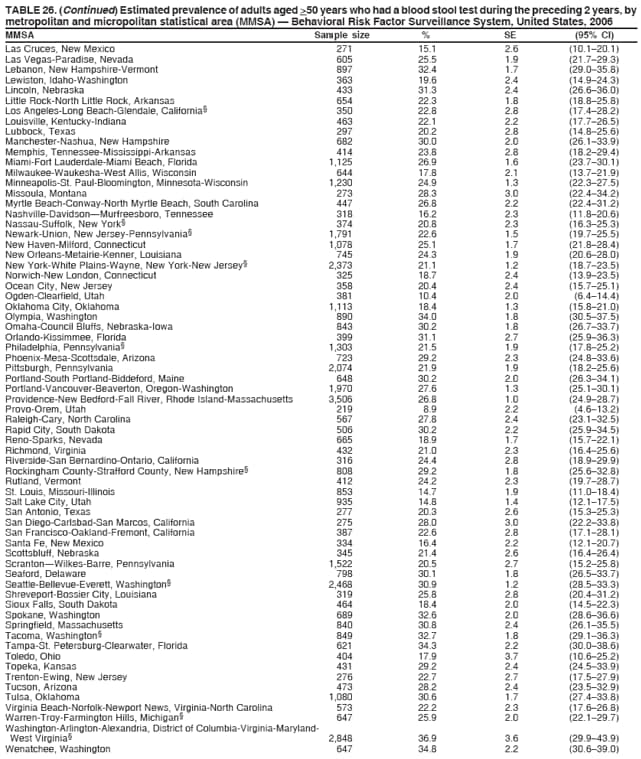  Return to top. Table 27 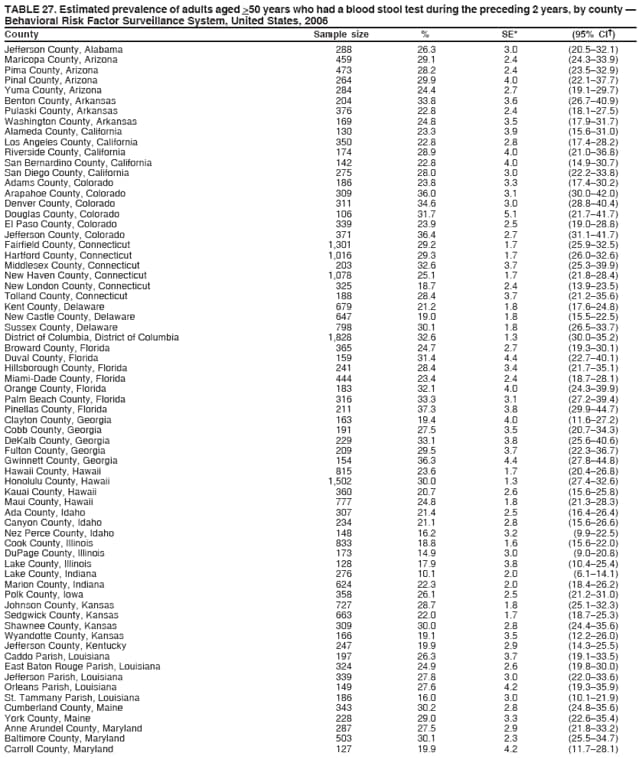 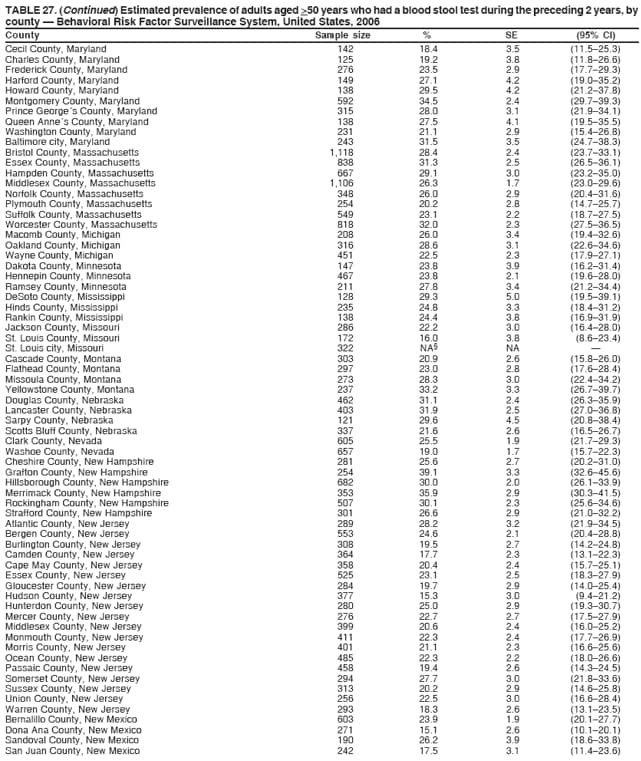 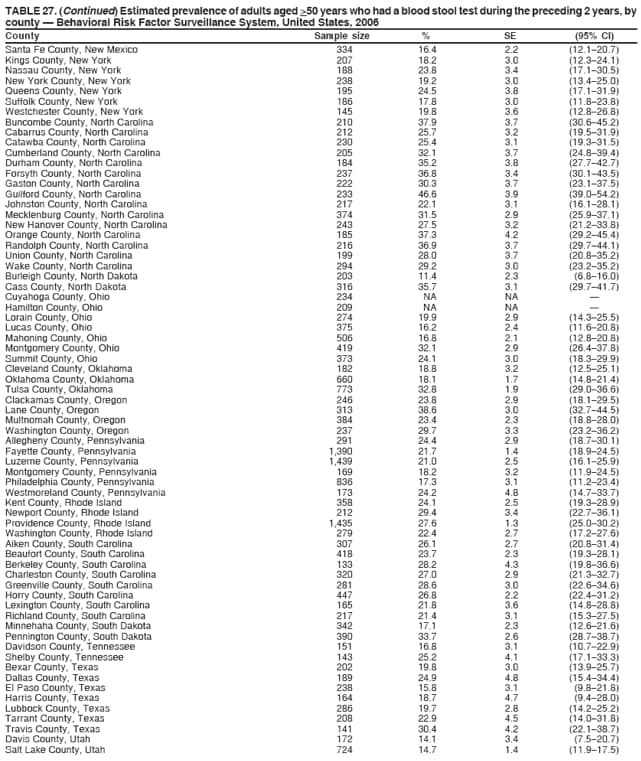 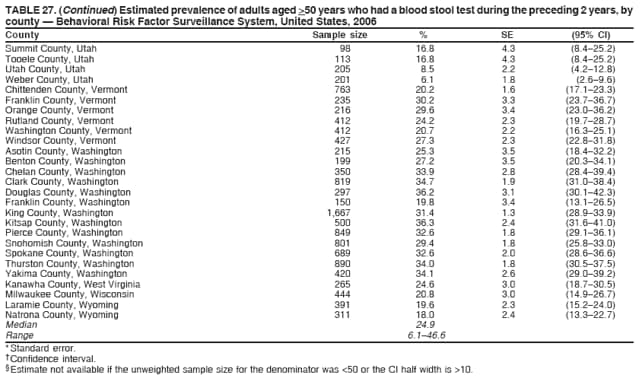 Return to top. Table 28 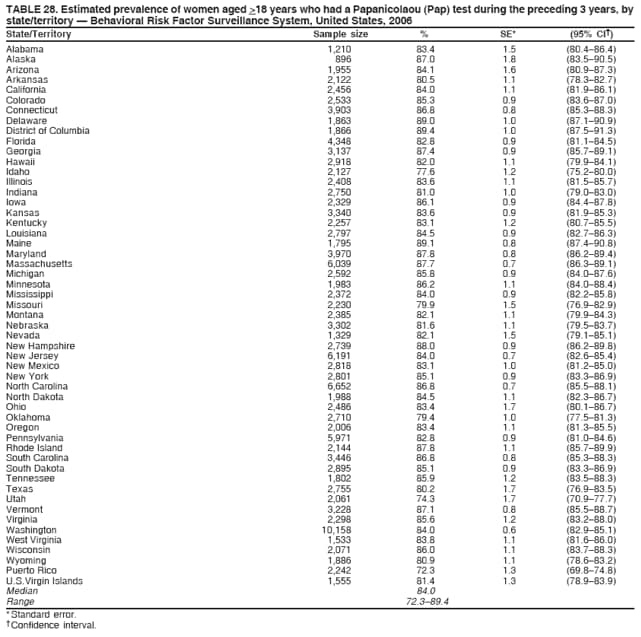 Return to top. Table 29 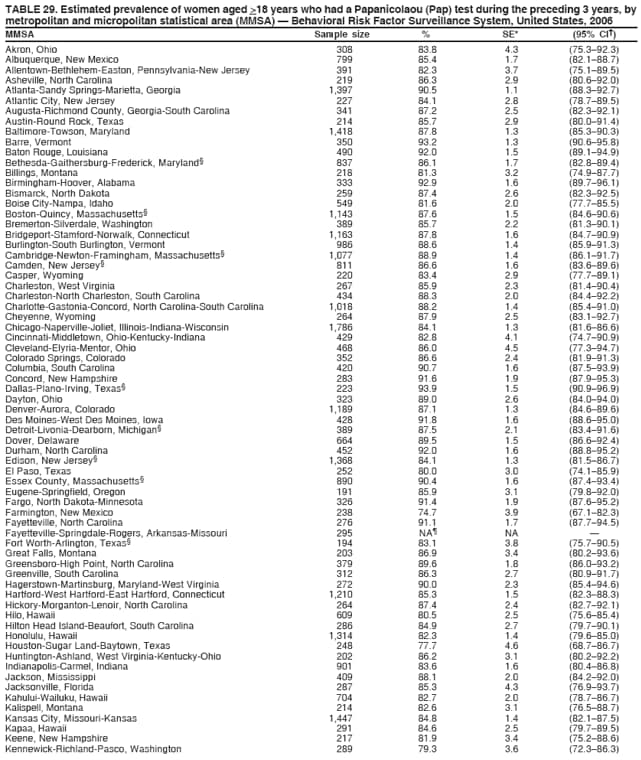 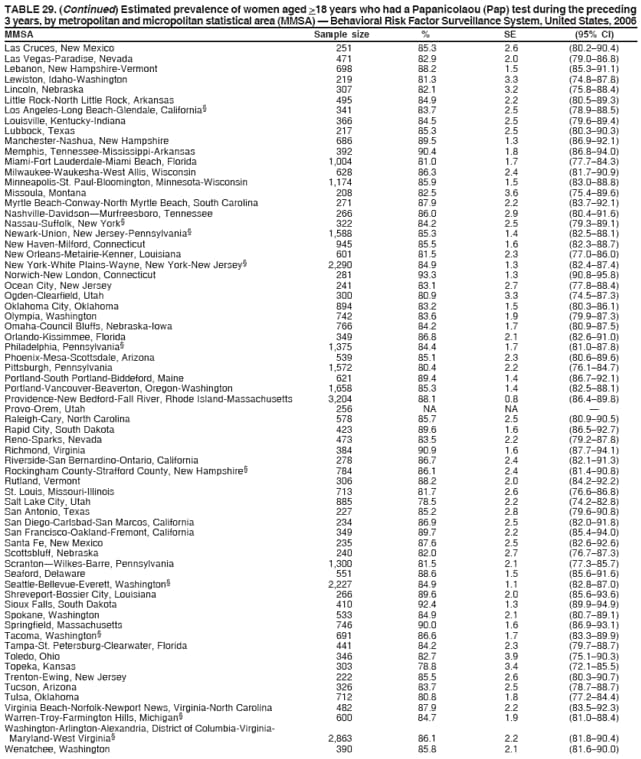  Return to top. Table 30 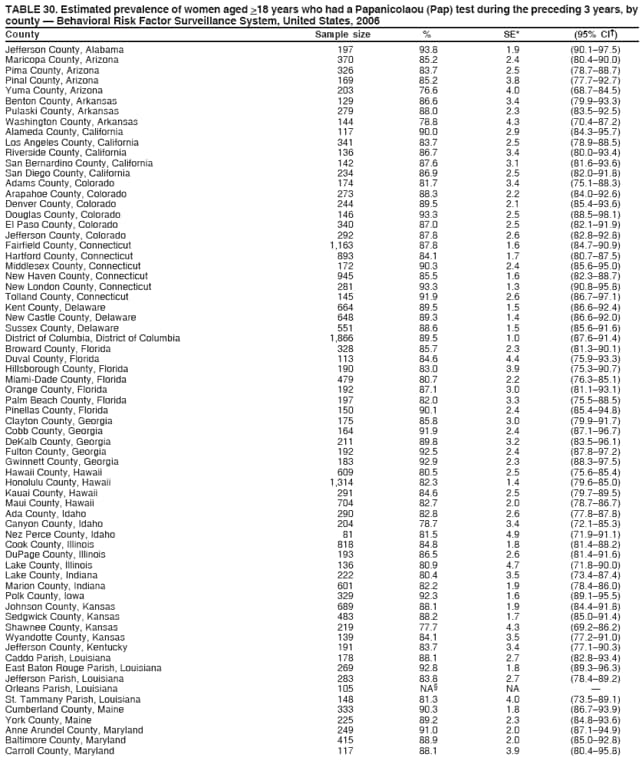 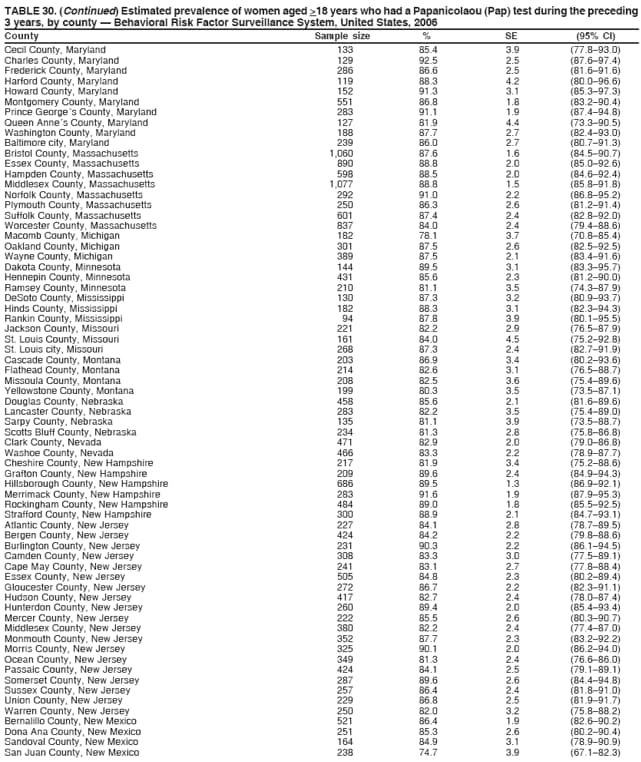 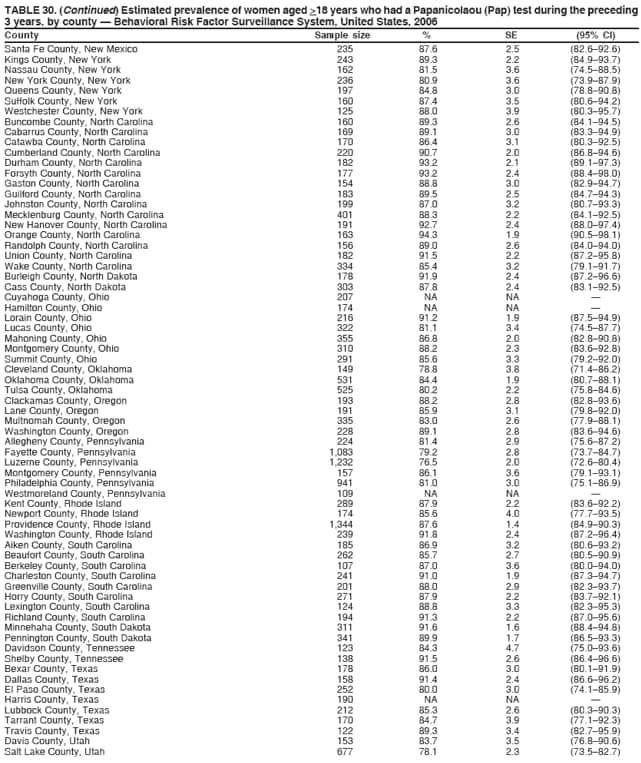 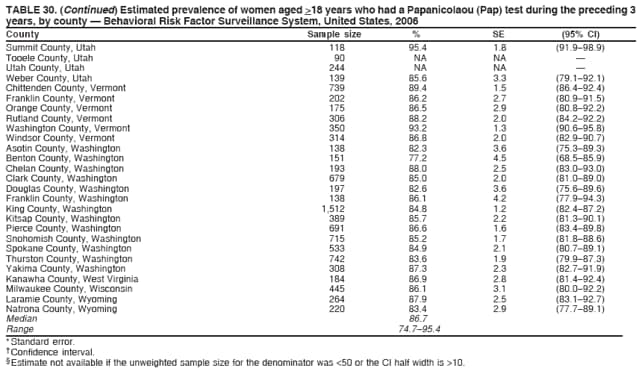 Return to top. Table 31 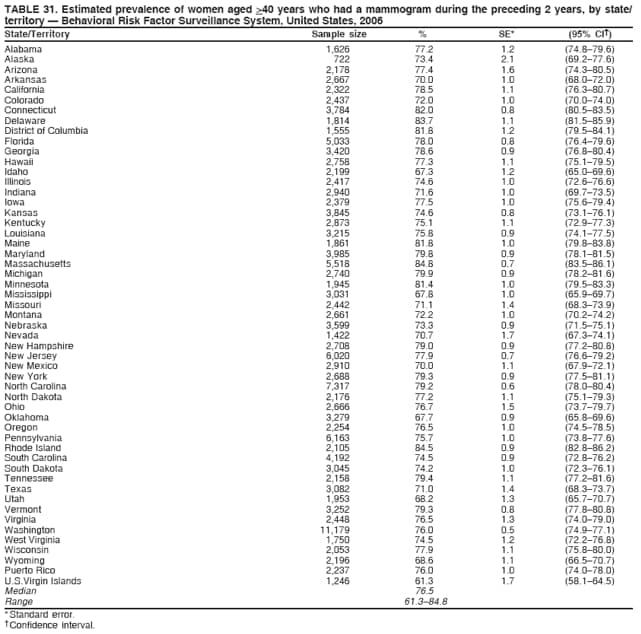 Return to top. Table 32 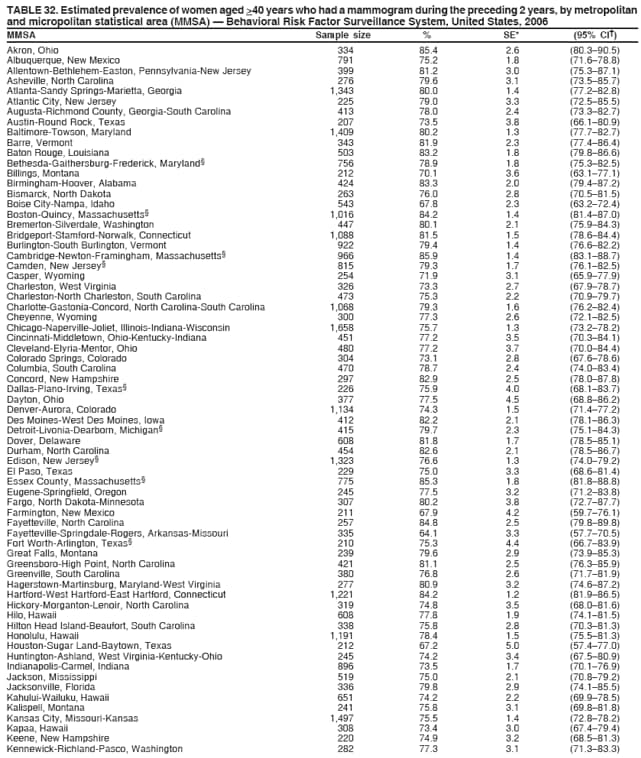 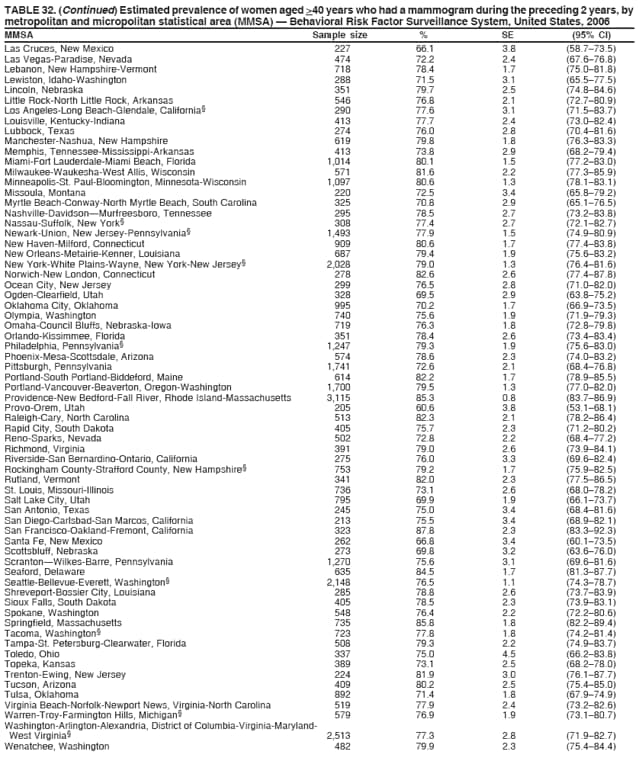  Return to top. Table 33 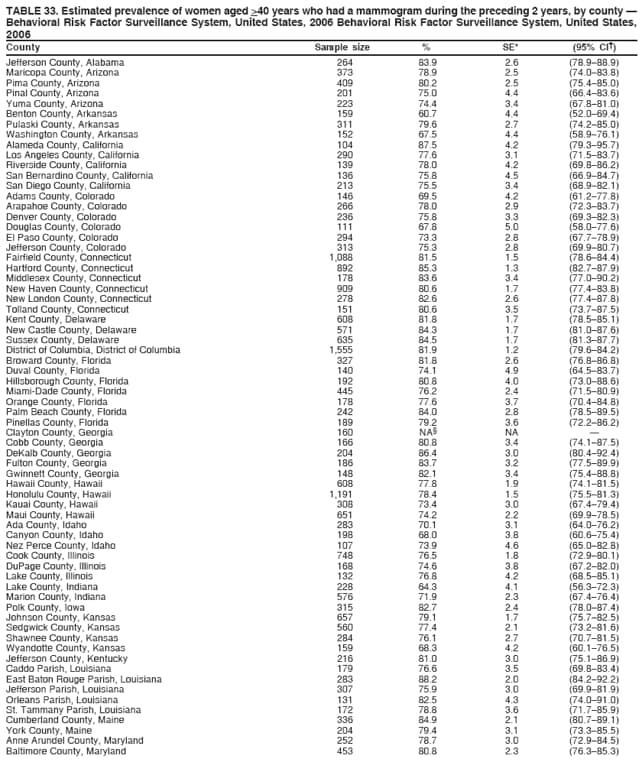 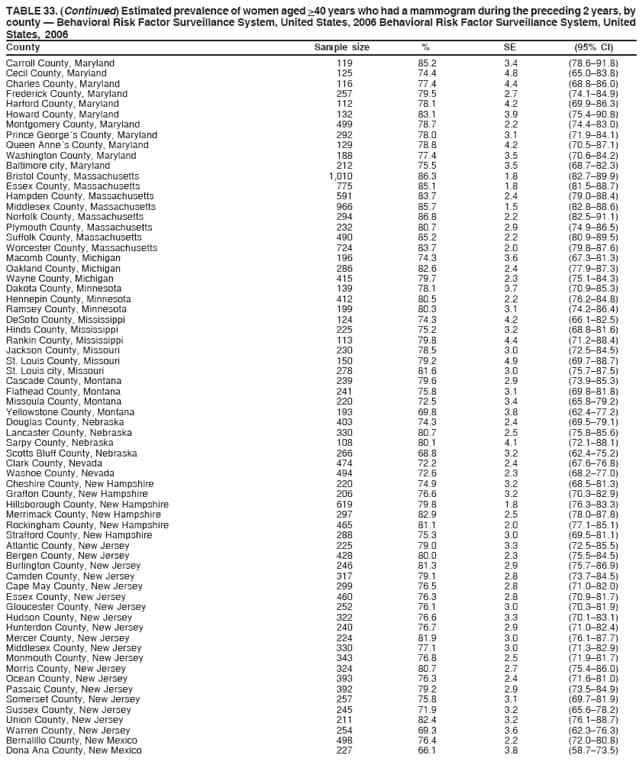 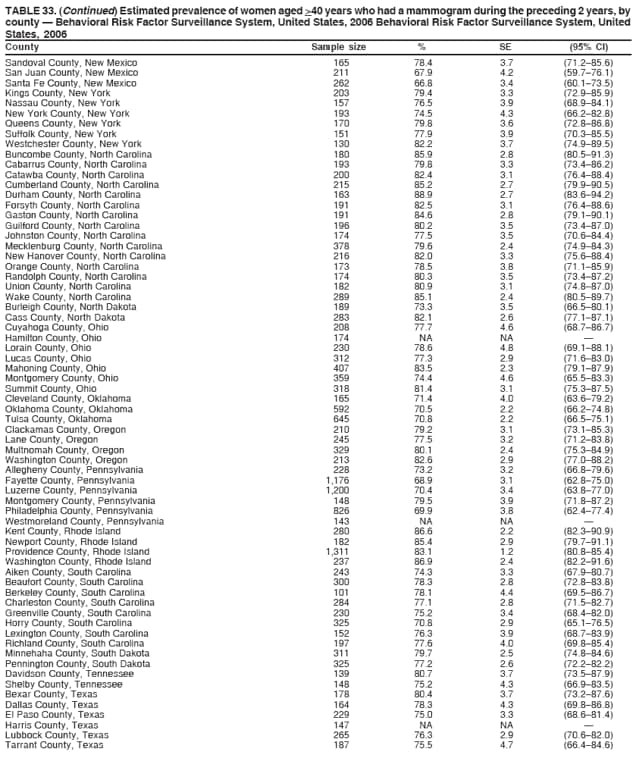 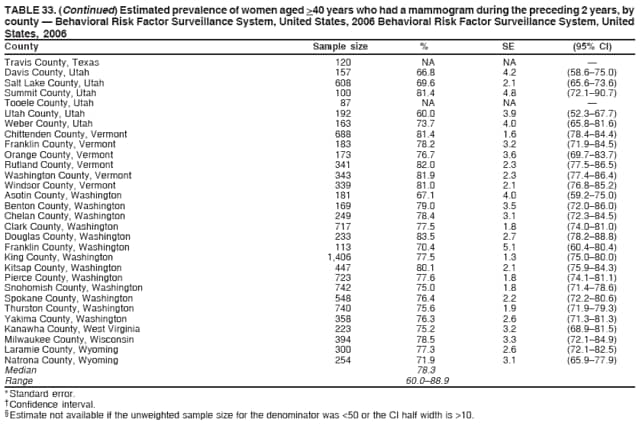 Return to top. Table 34 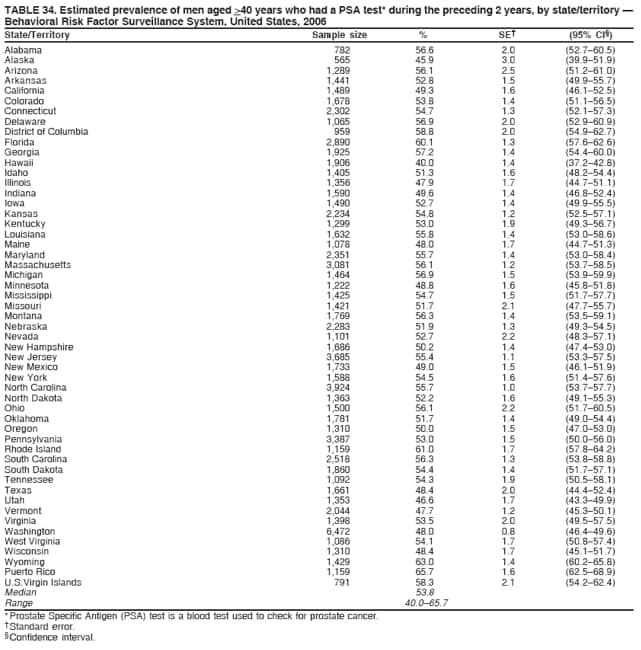 Return to top. Table 35 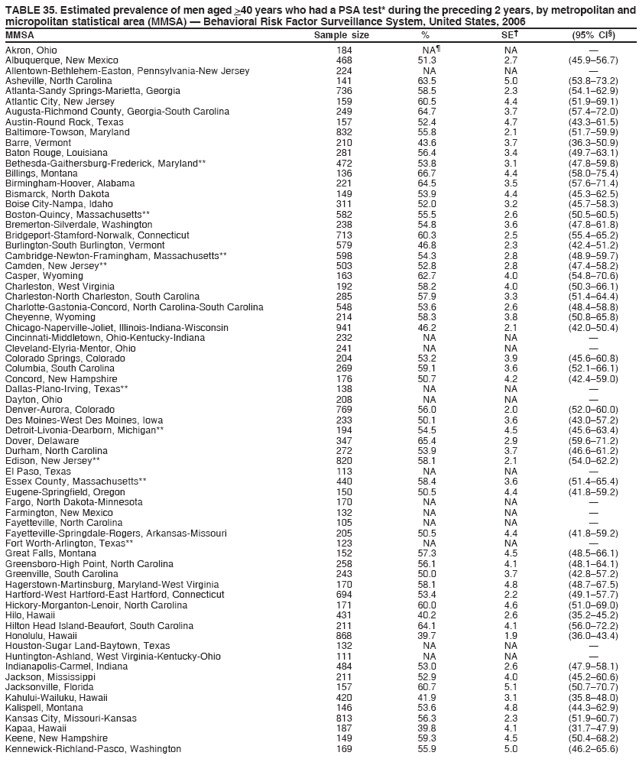 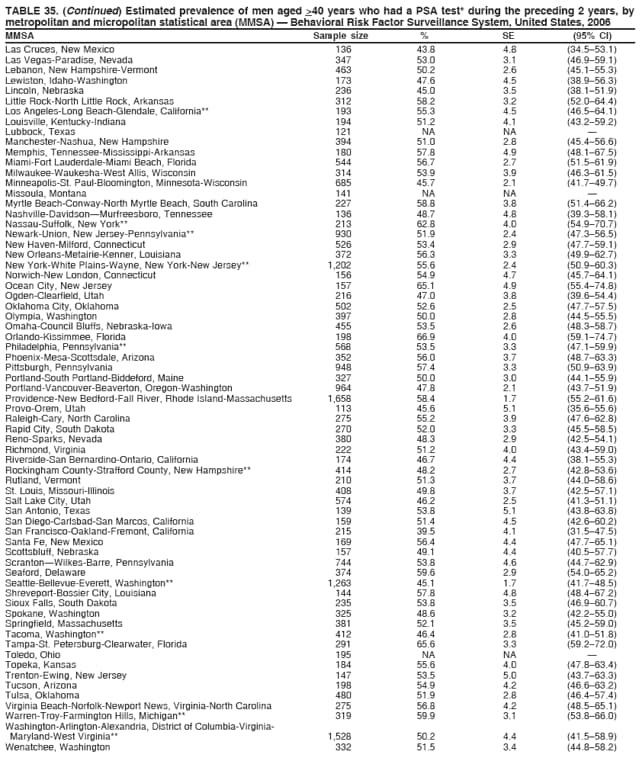  Return to top. Table 36 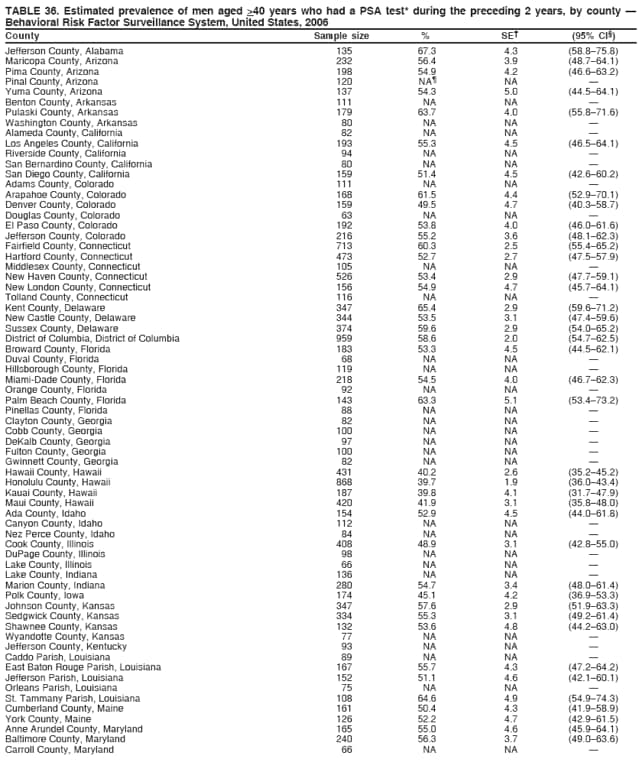 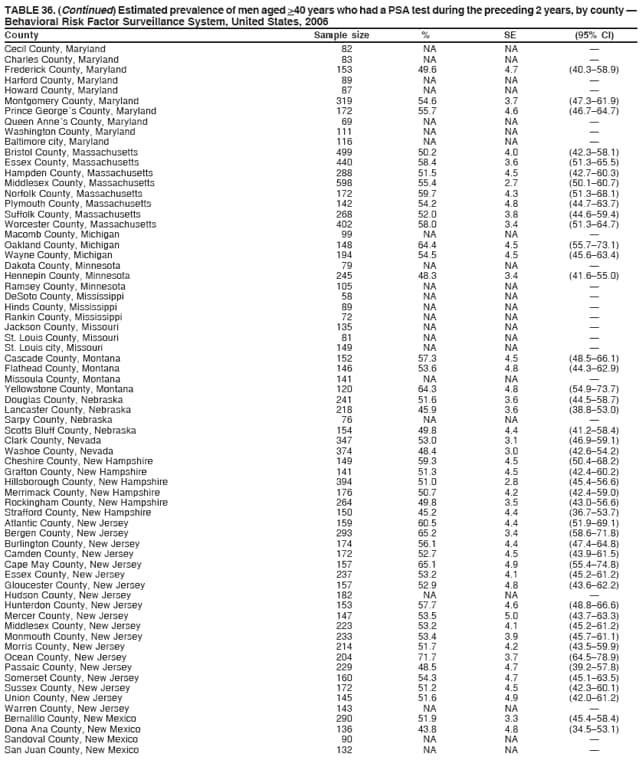 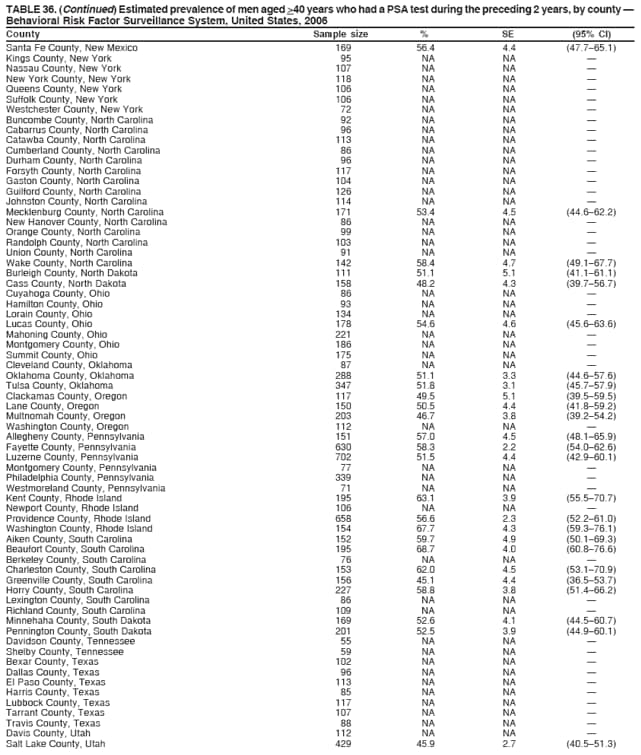 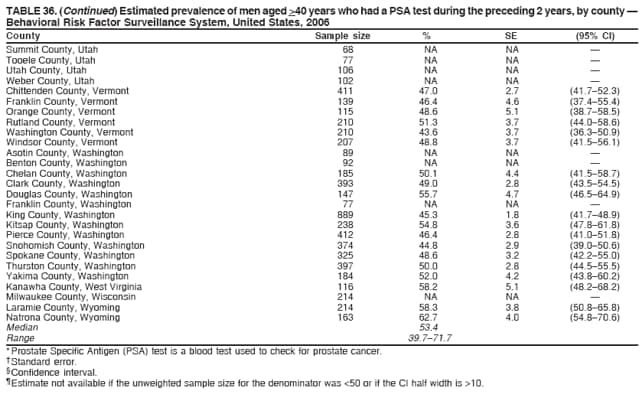 Return to top. Table 37 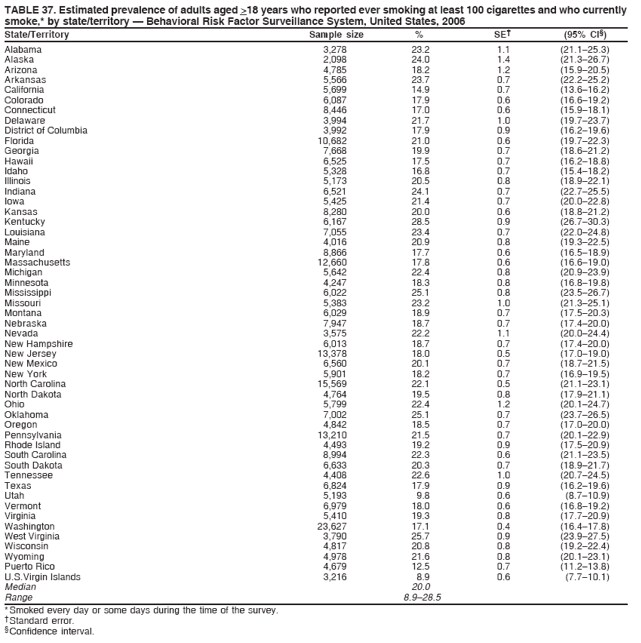 Return to top. Table 38 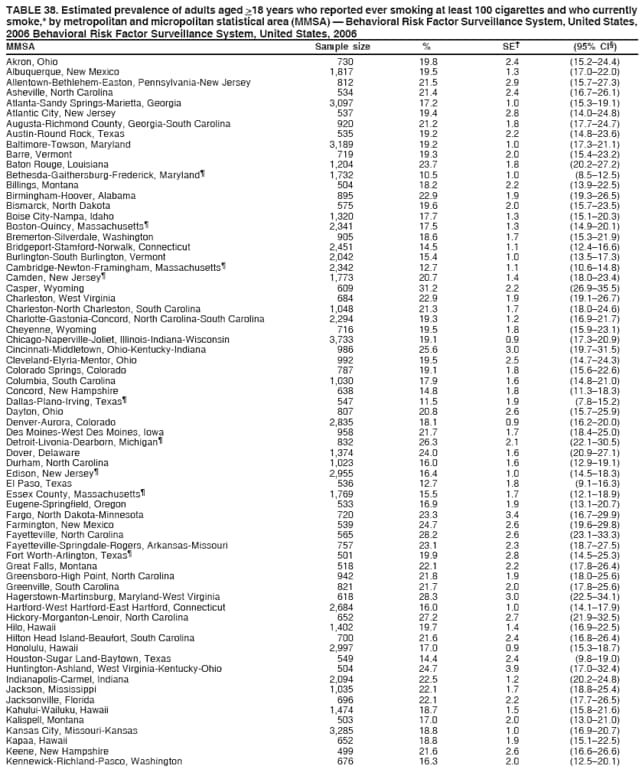 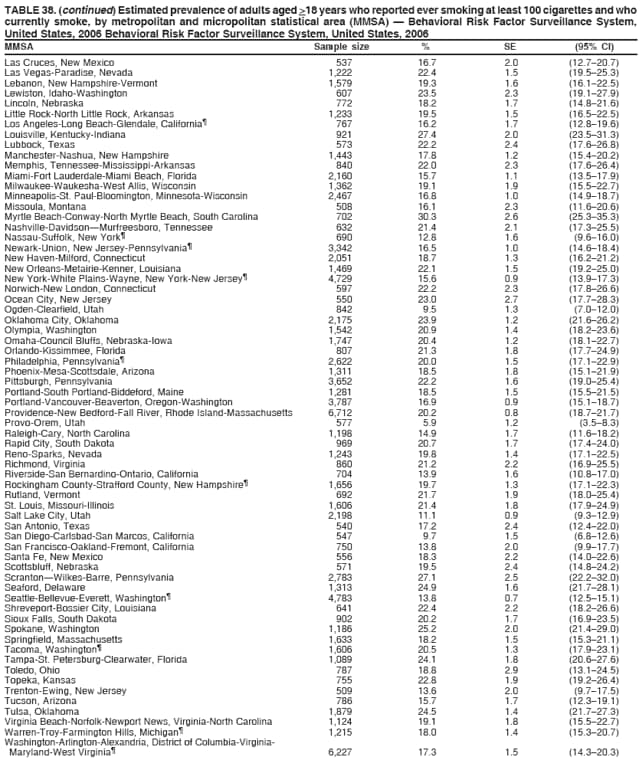 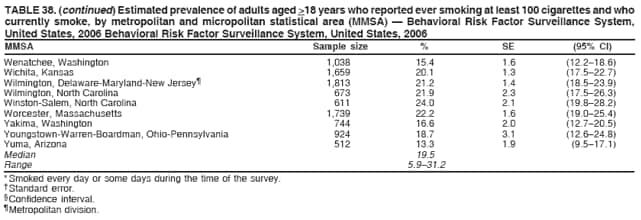 Return to top. Table 39 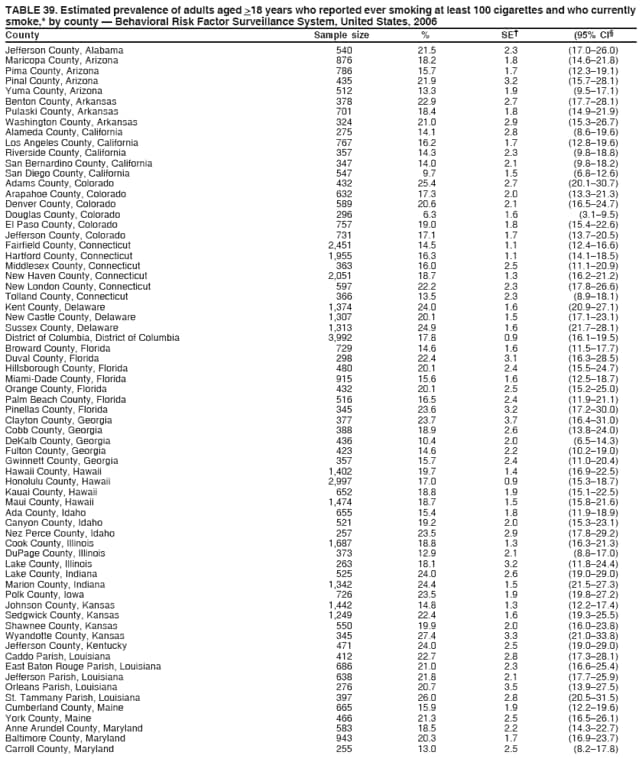 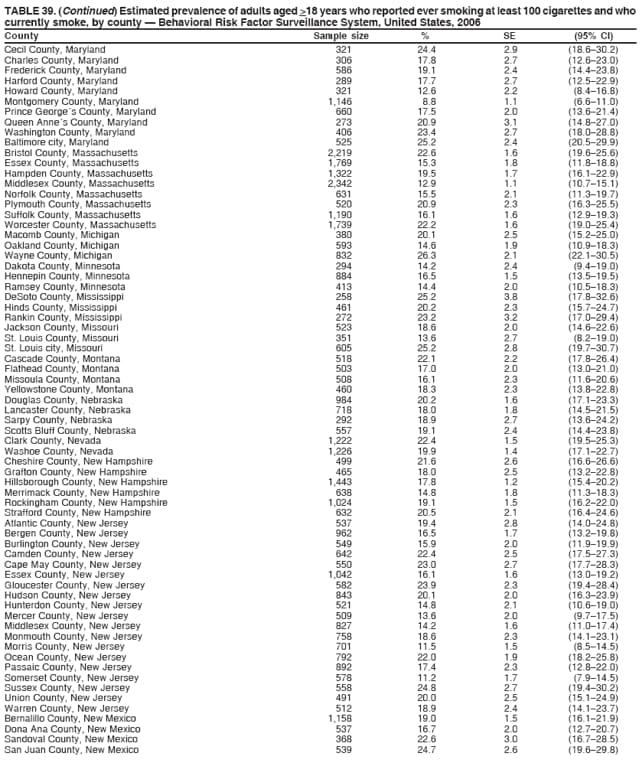 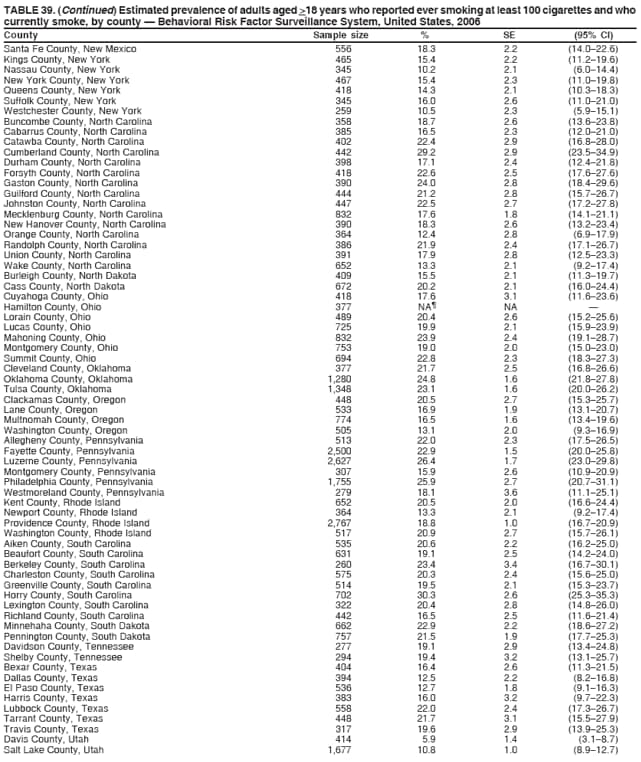 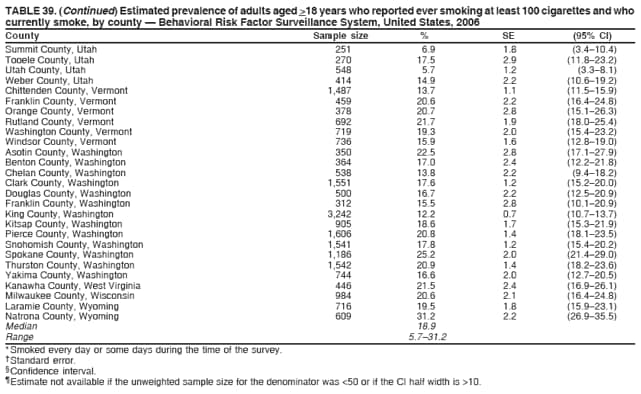 Return to top. Table 40 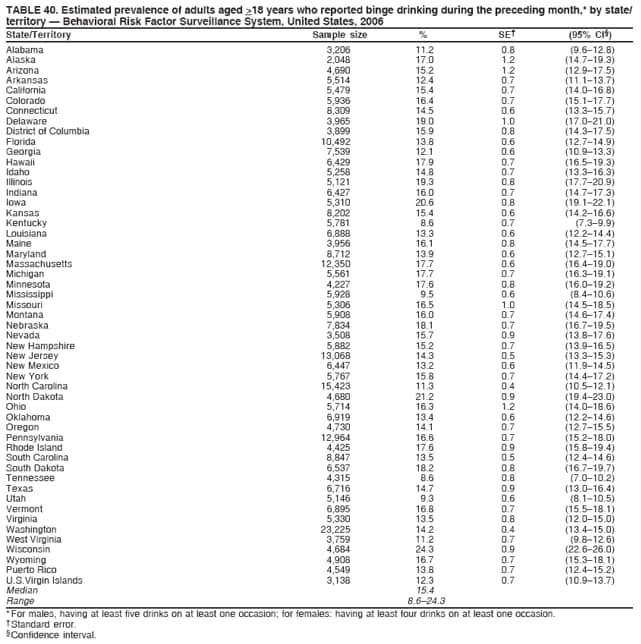 Return to top. Table 41 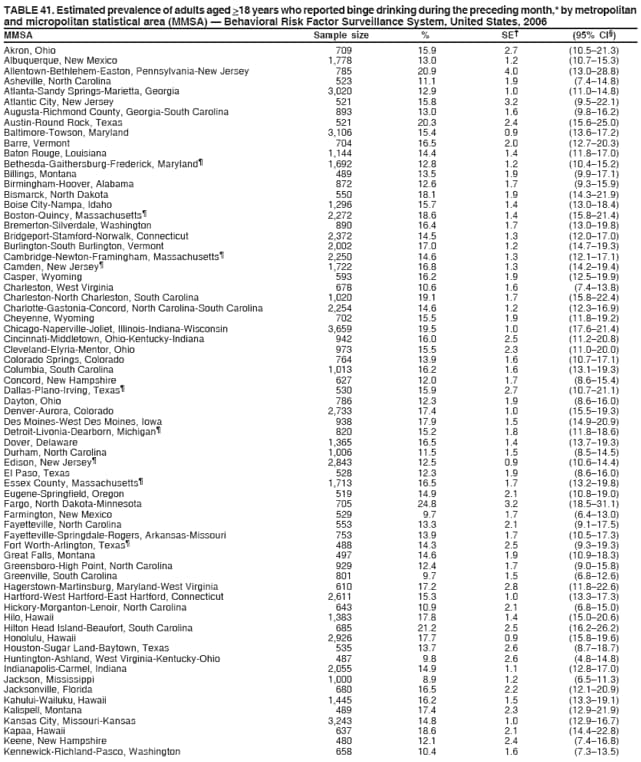 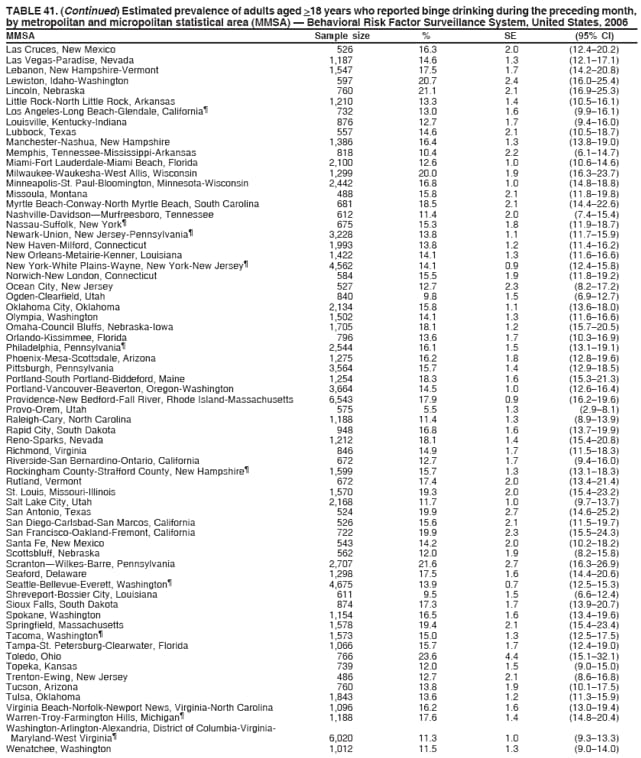  Return to top. Table 42 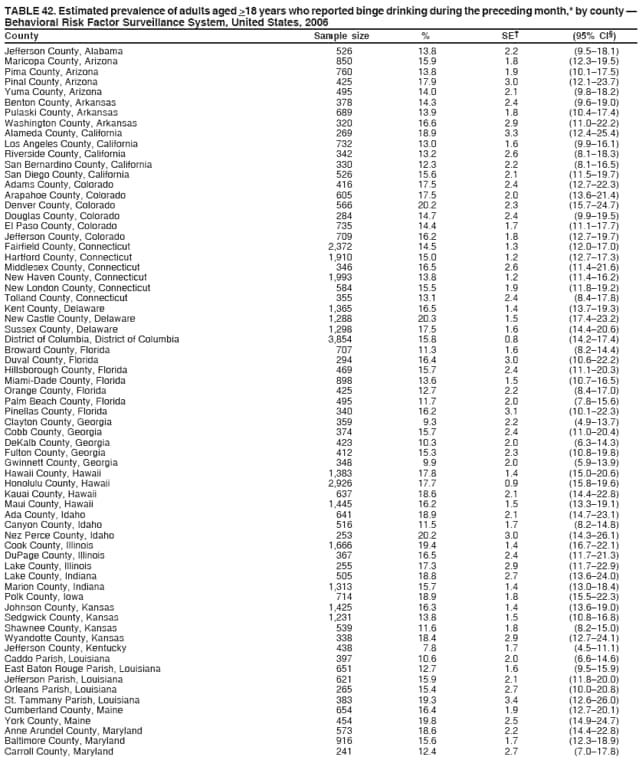 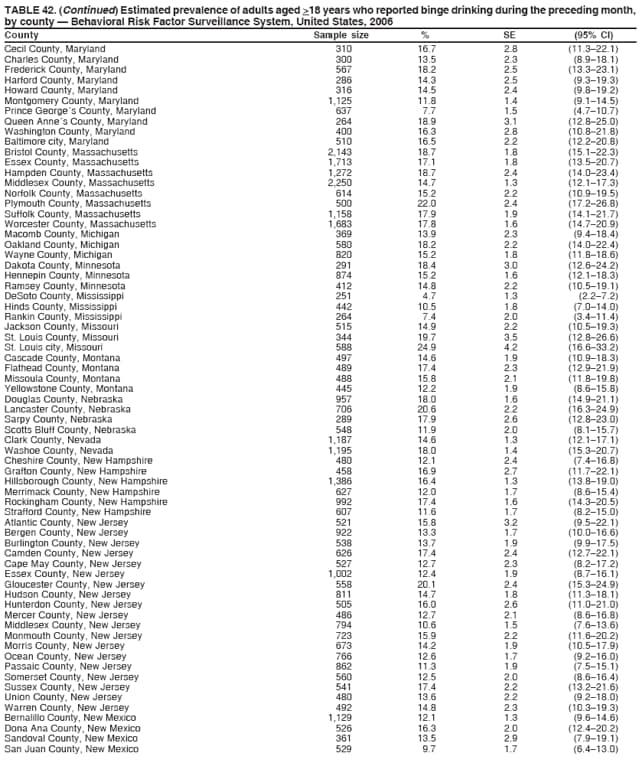 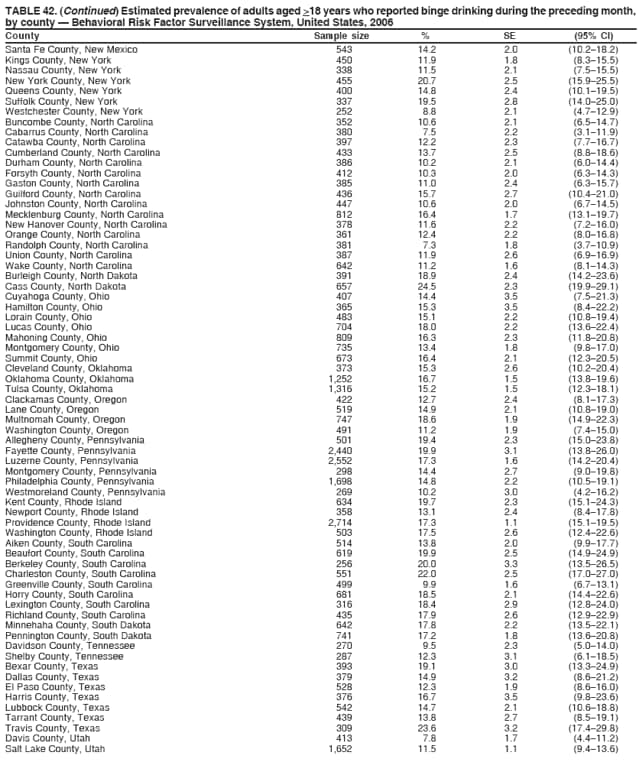 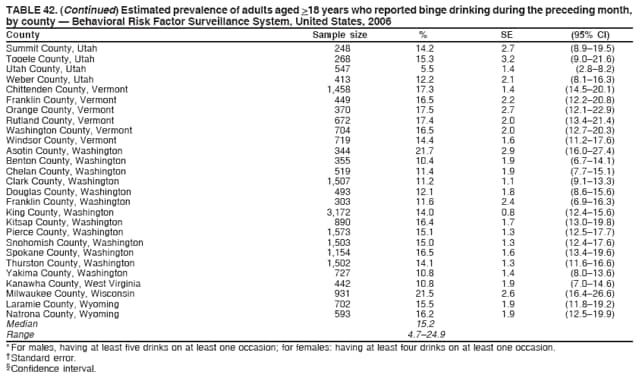 Return to top. Table 43 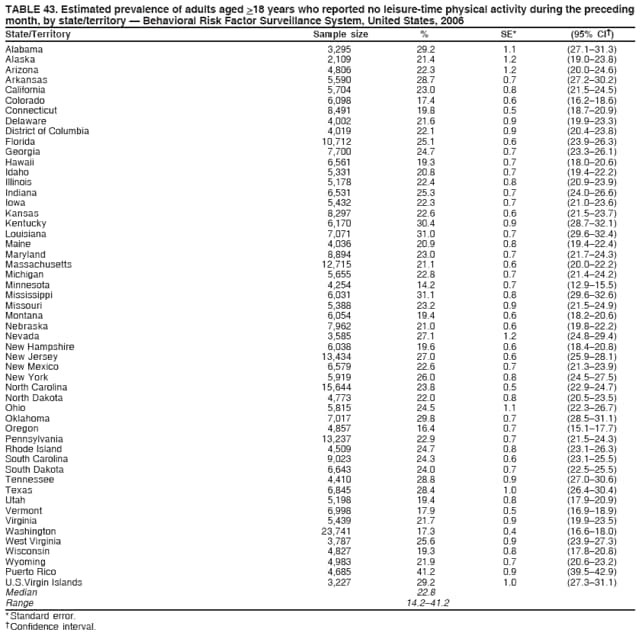 Return to top. Table 44 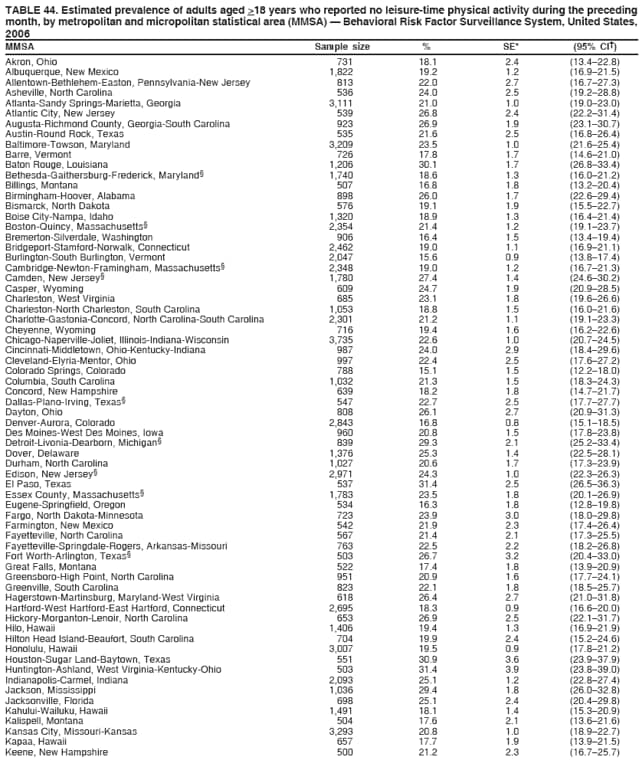 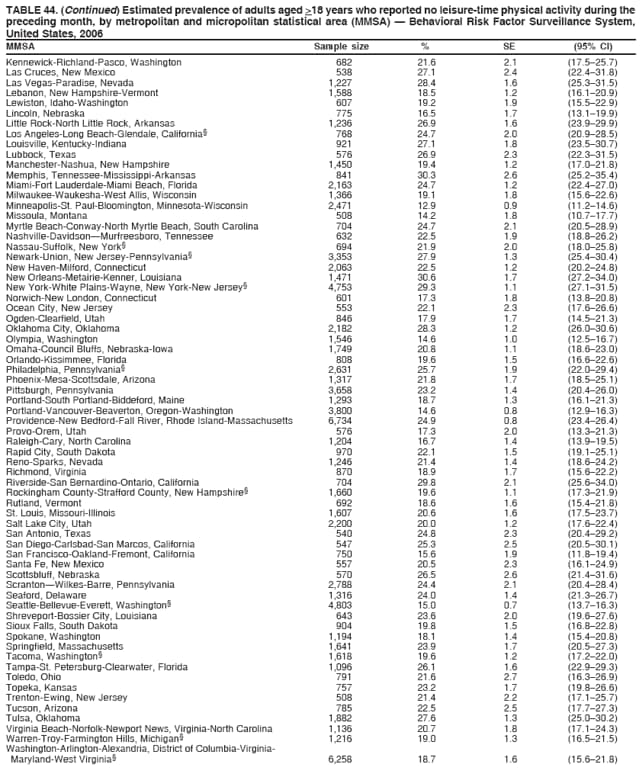  Return to top. Table 45 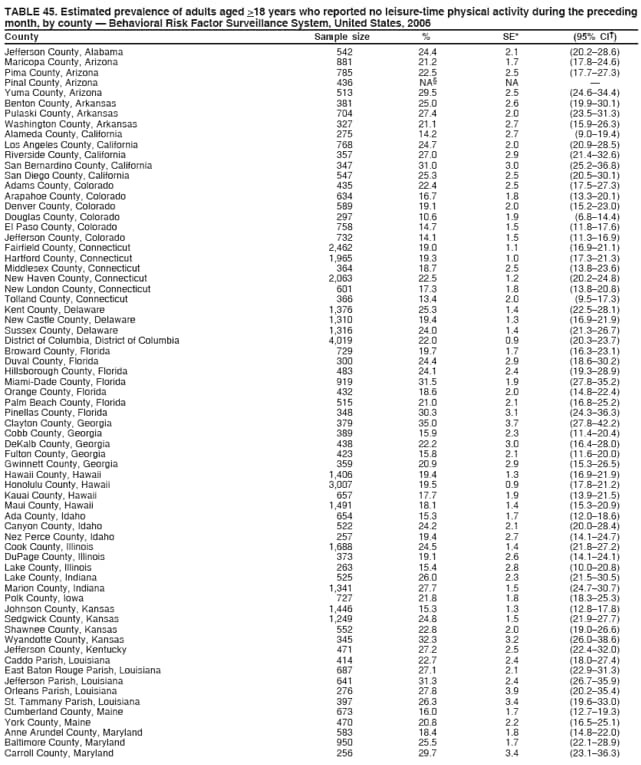 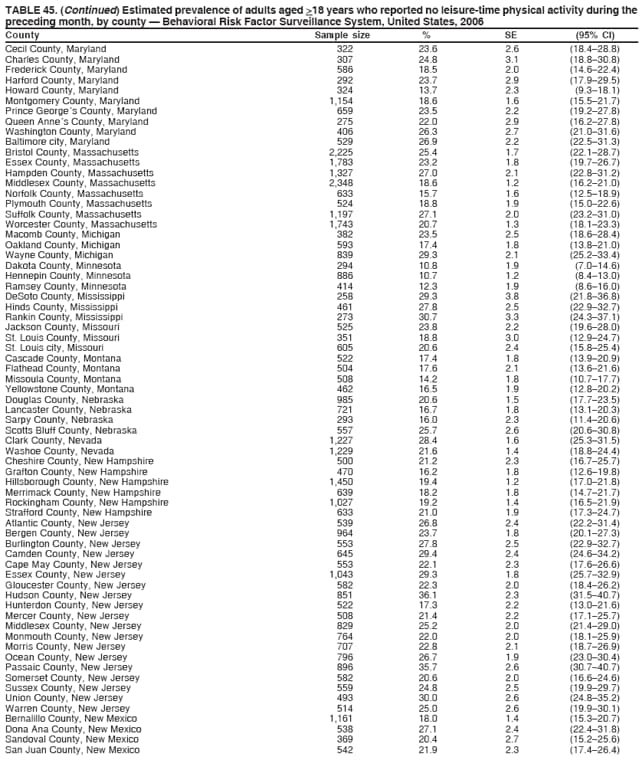 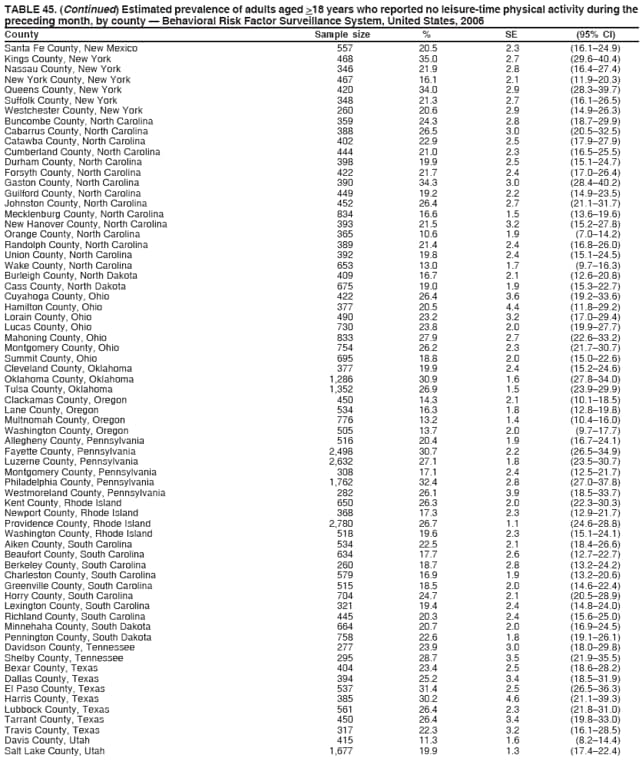 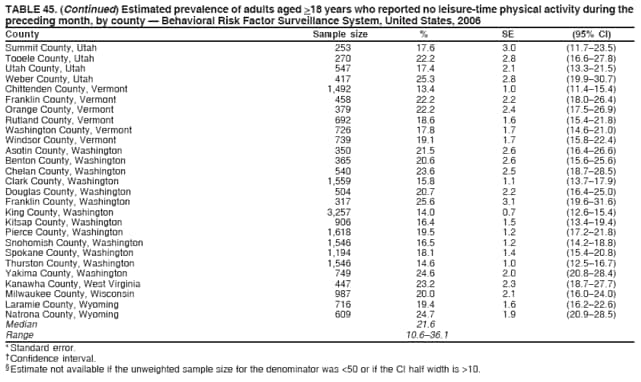 Return to top. Table 46 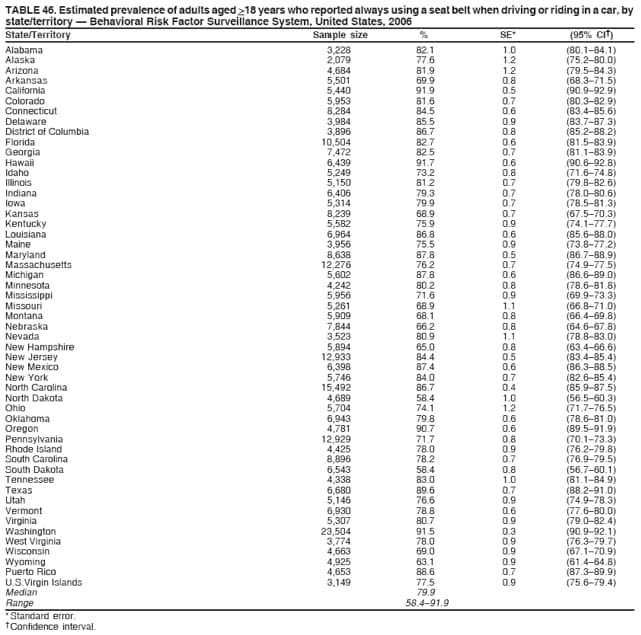 Return to top. Table 47 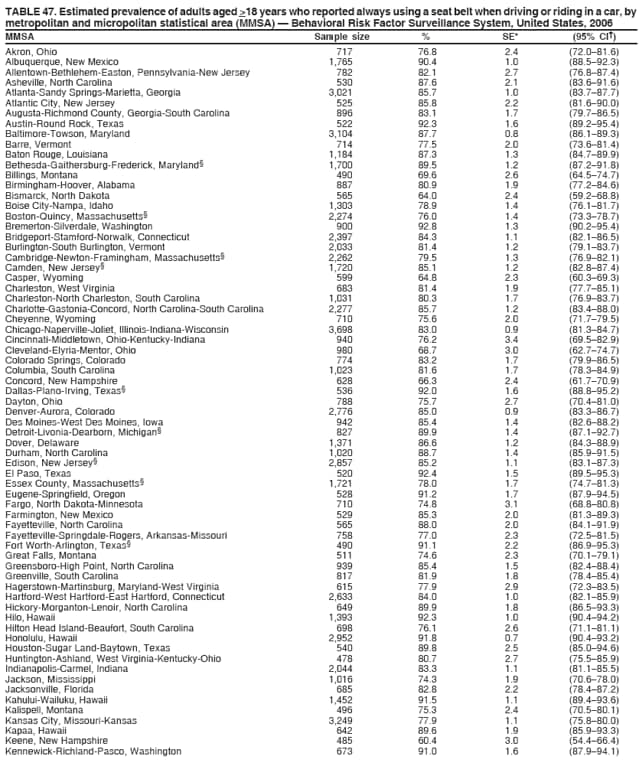 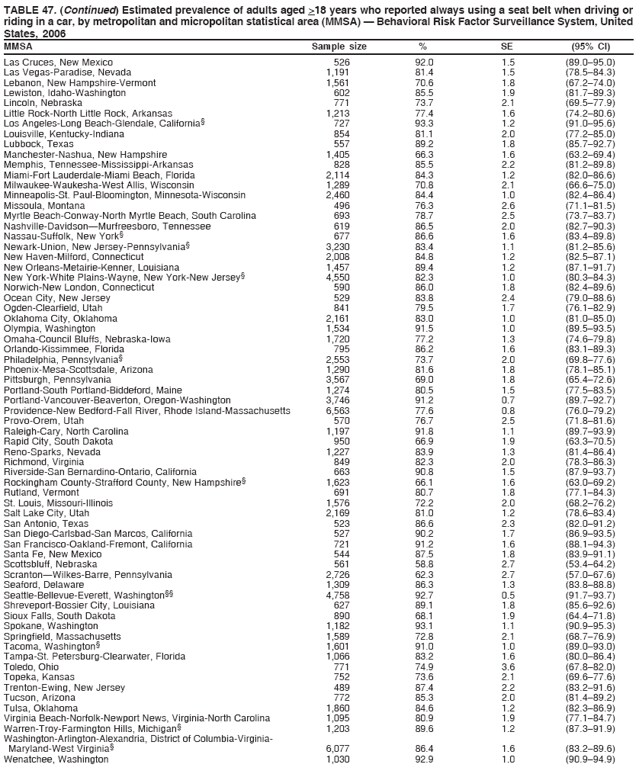  Return to top. Table 48 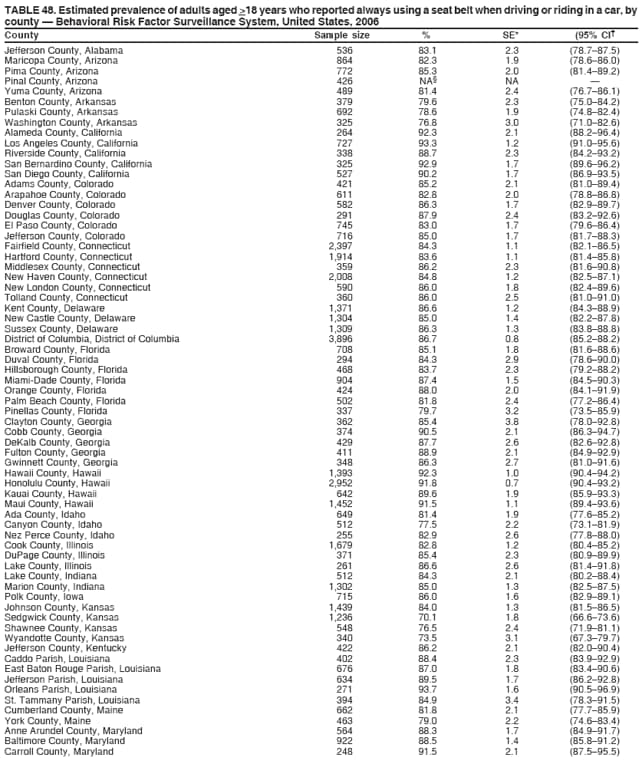 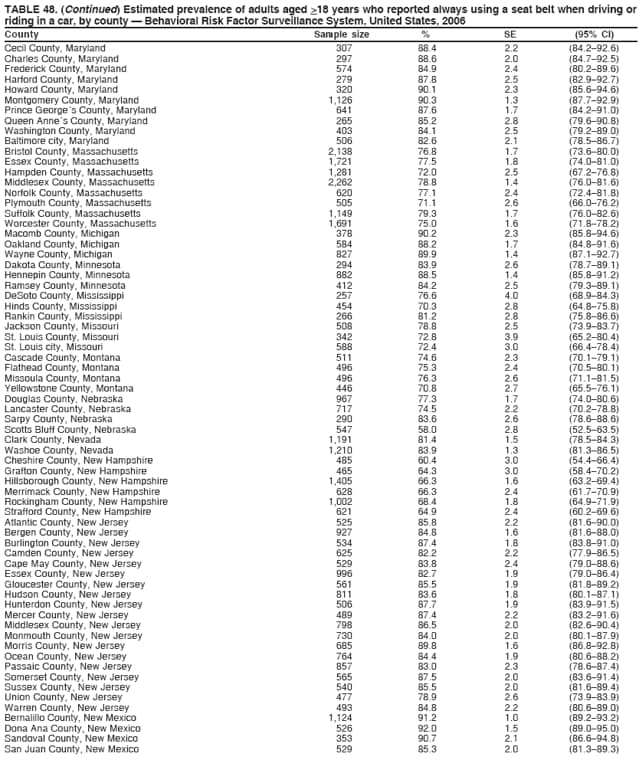 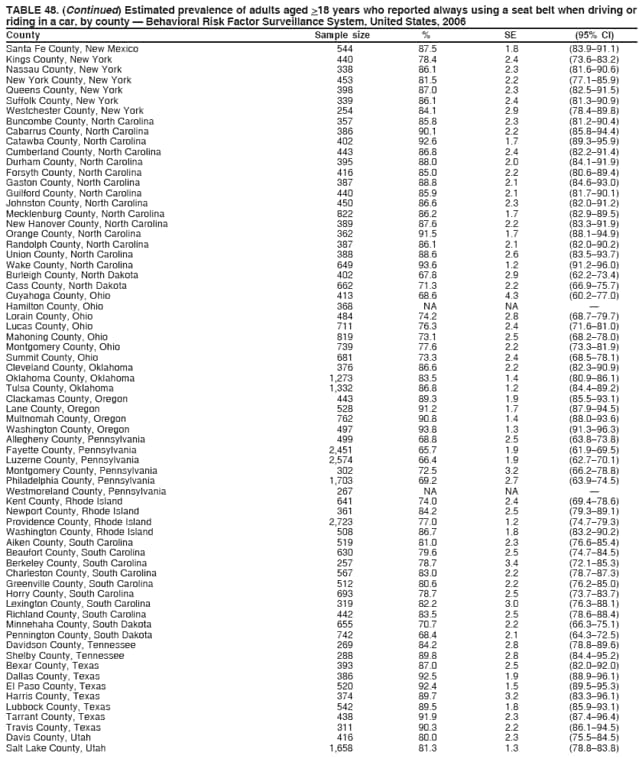 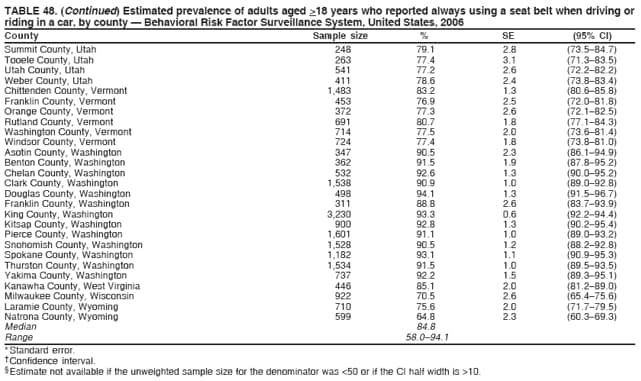 Return to top. Table 49 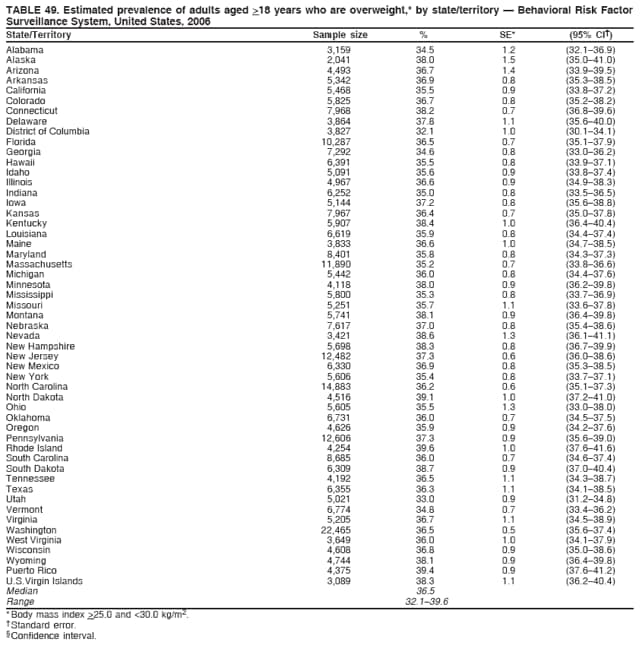 Return to top. Table 50 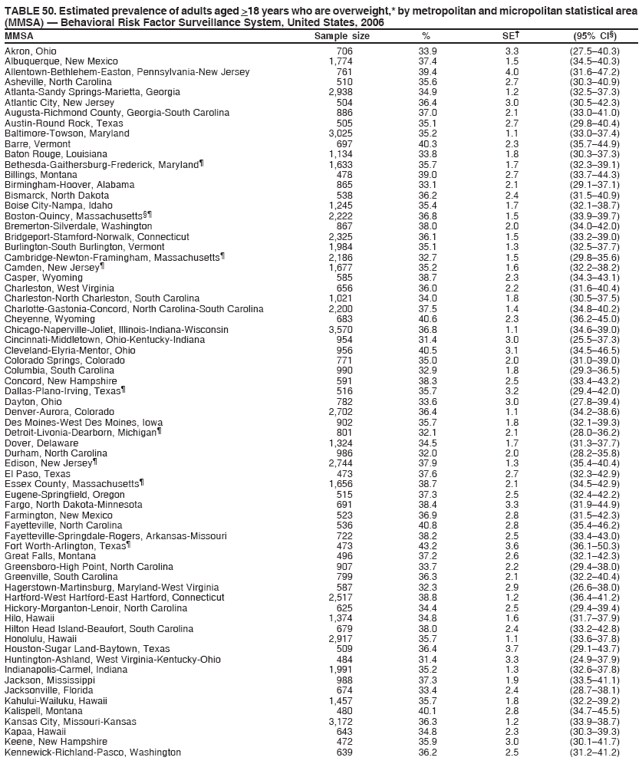 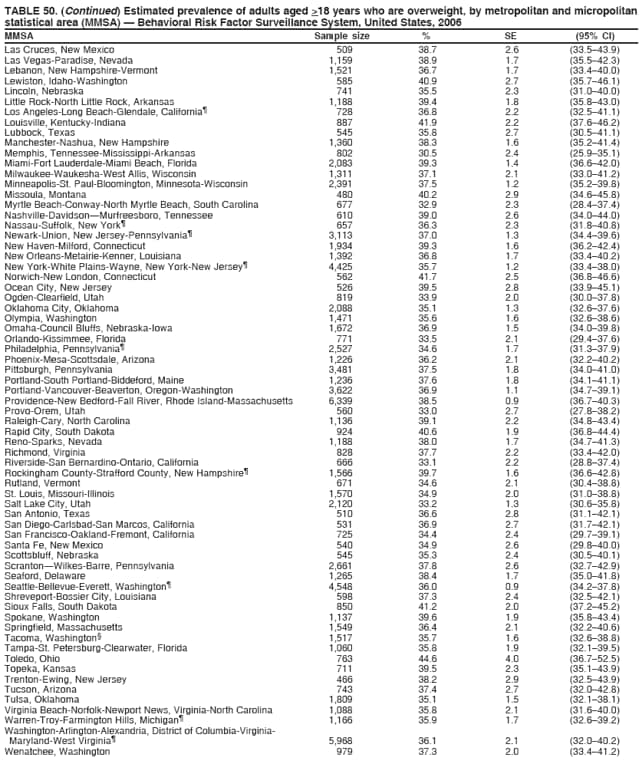  Return to top. Table 51 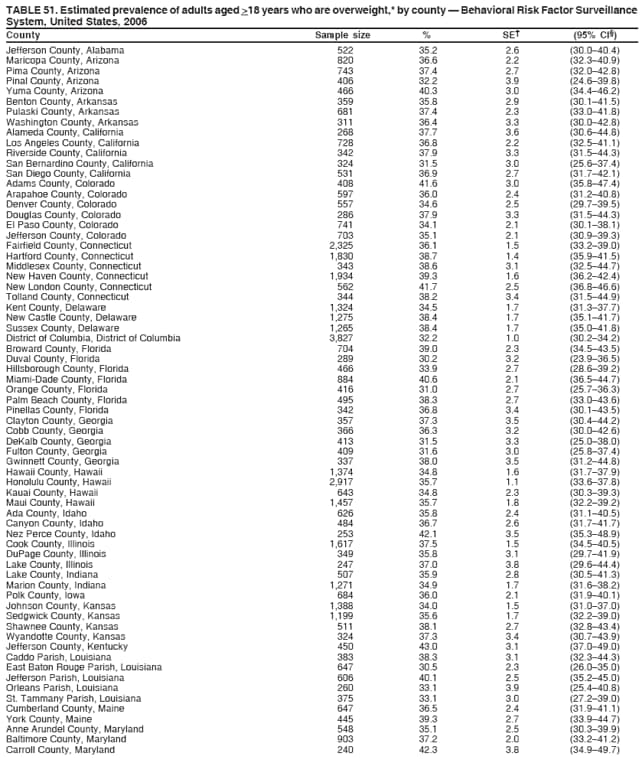 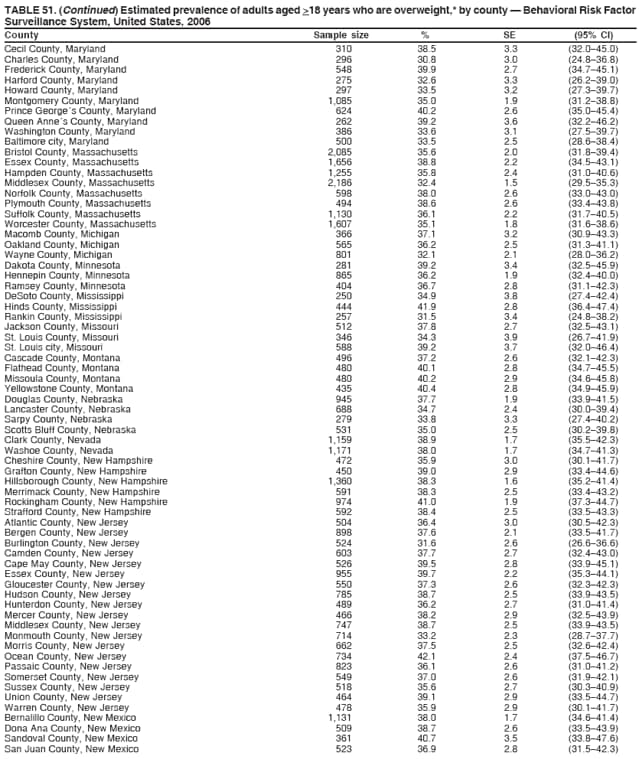 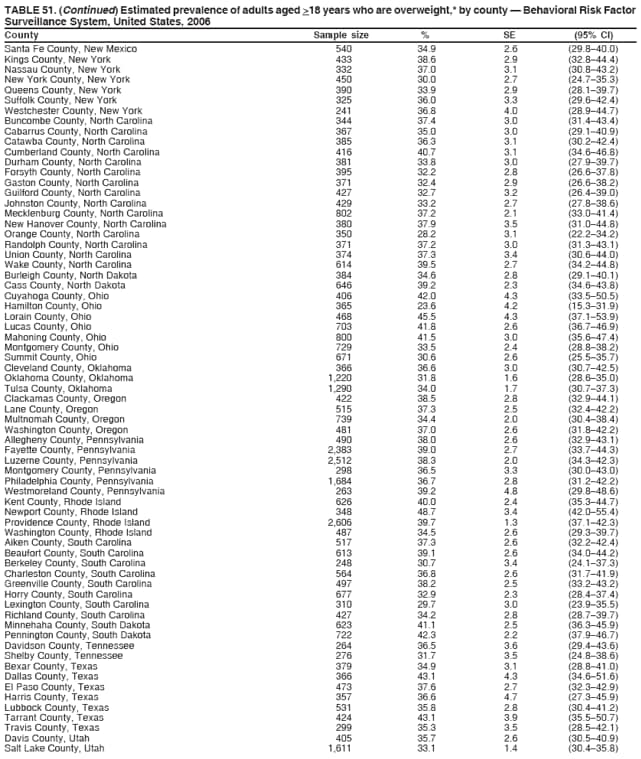 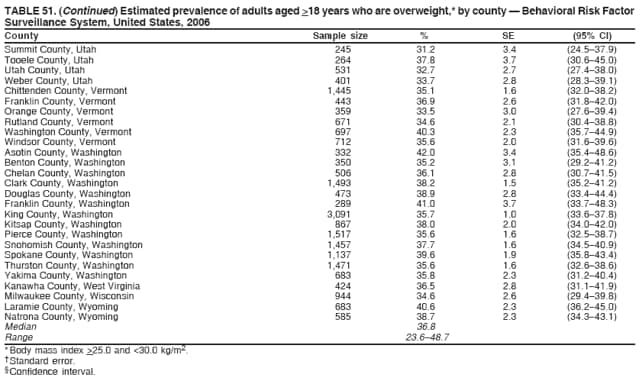 Return to top. Table 52 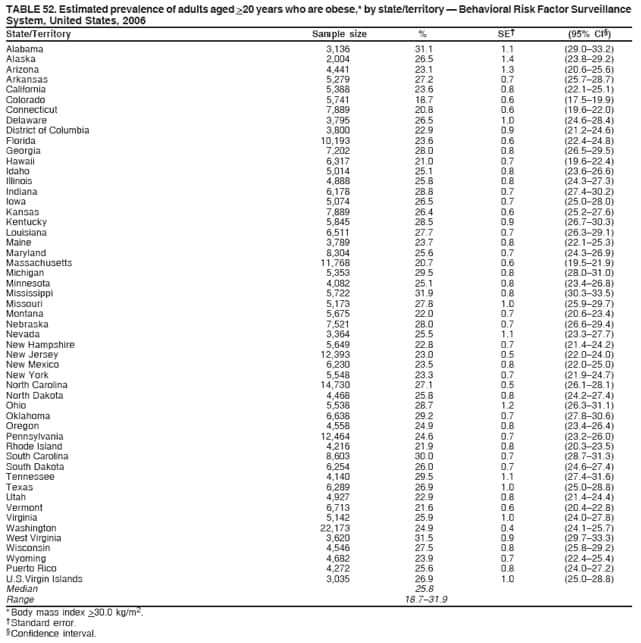 Return to top. Table 53 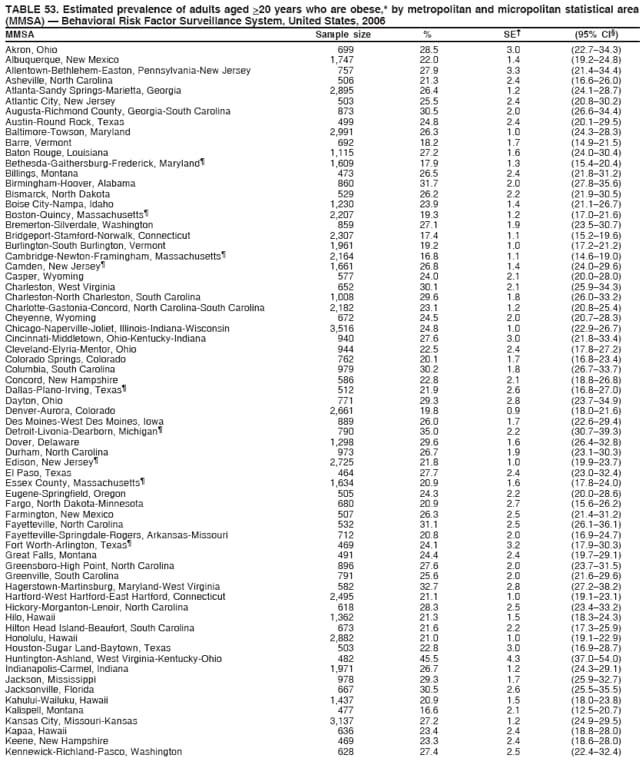 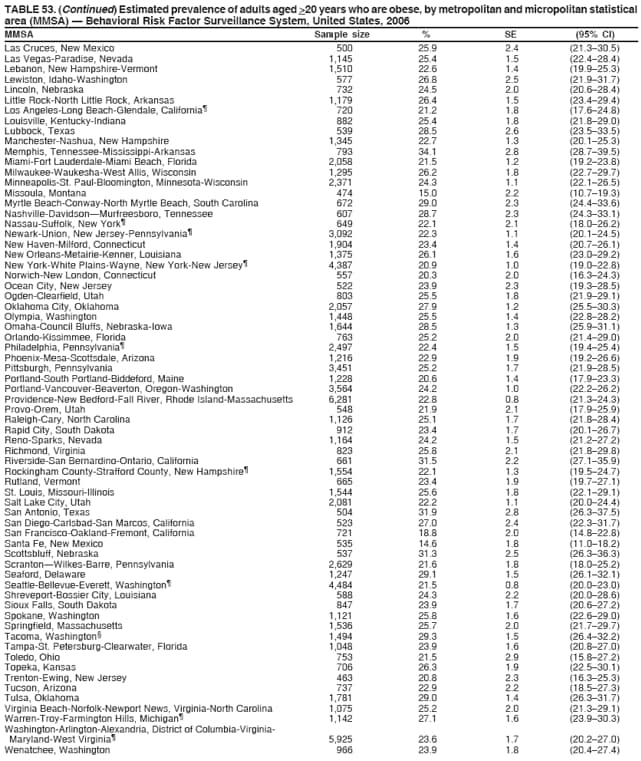  Return to top. Table 54 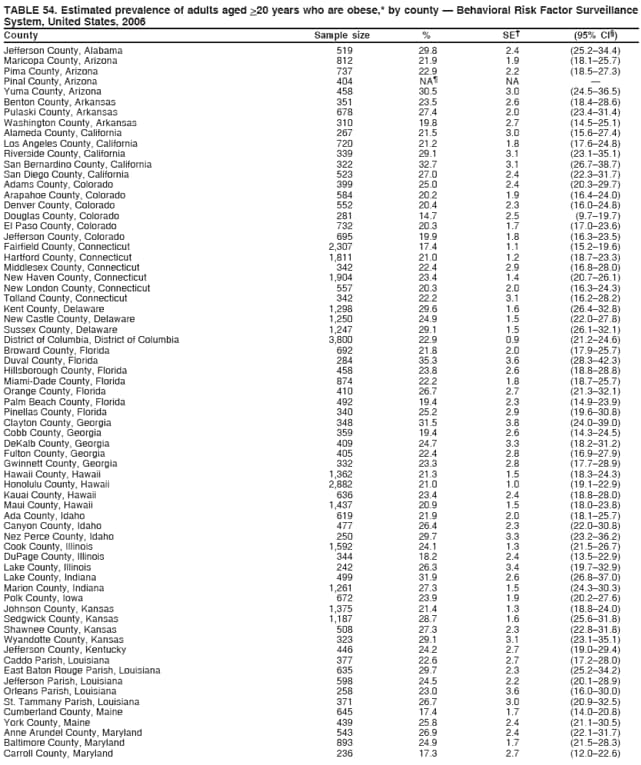 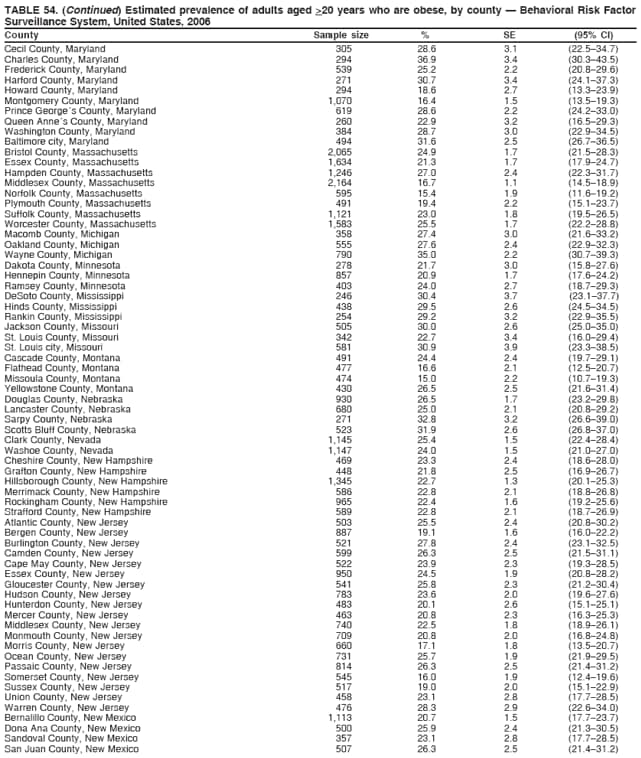 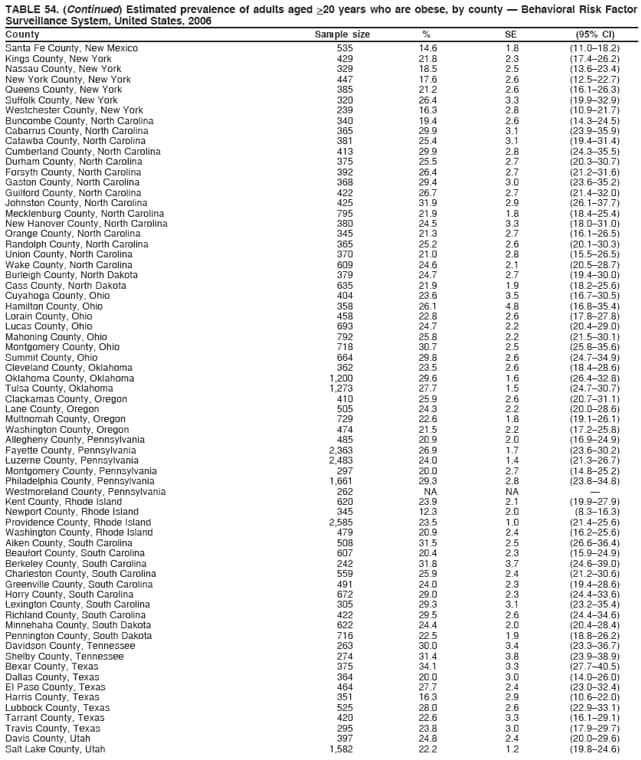 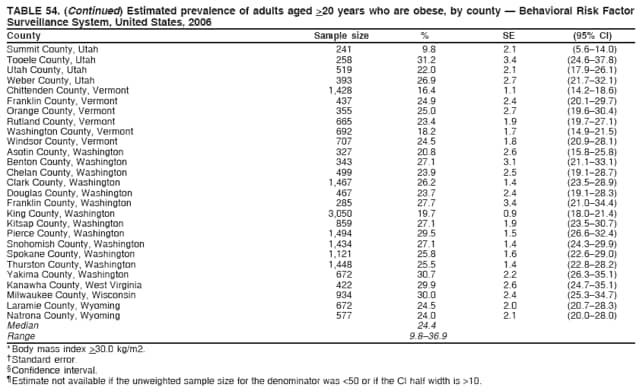 Return to top. Table 55 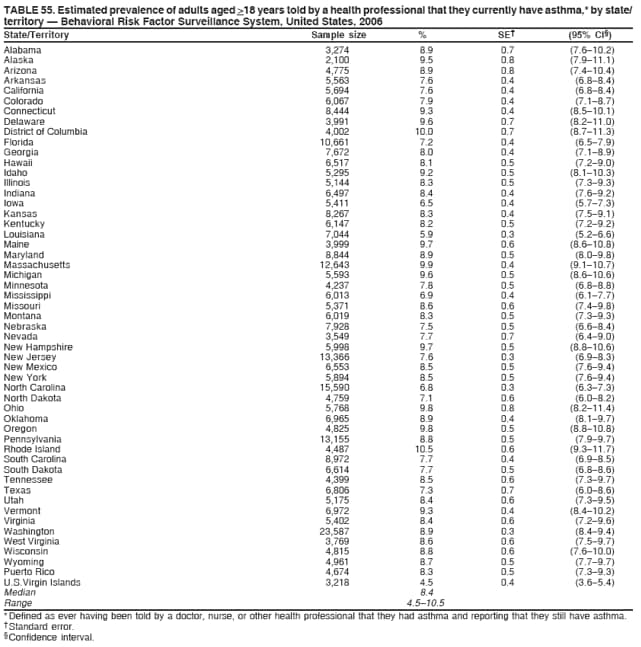 Return to top. Table 56 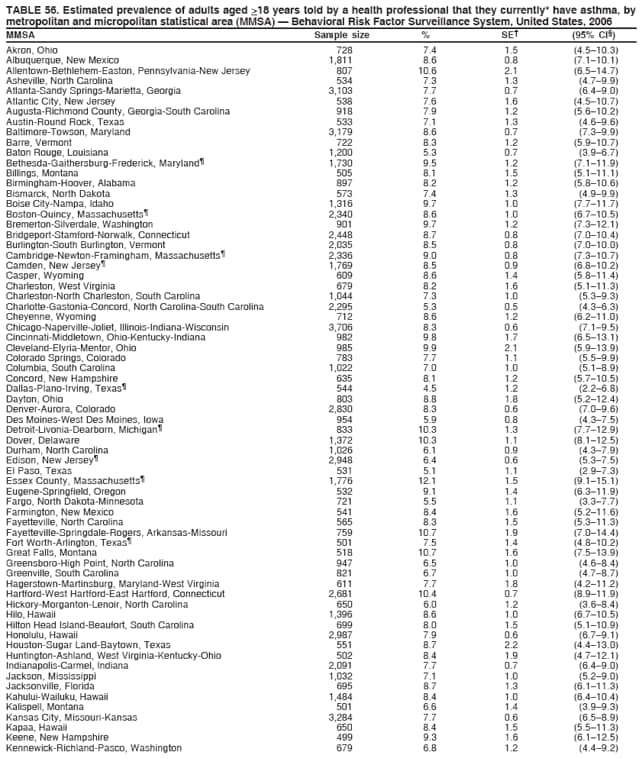 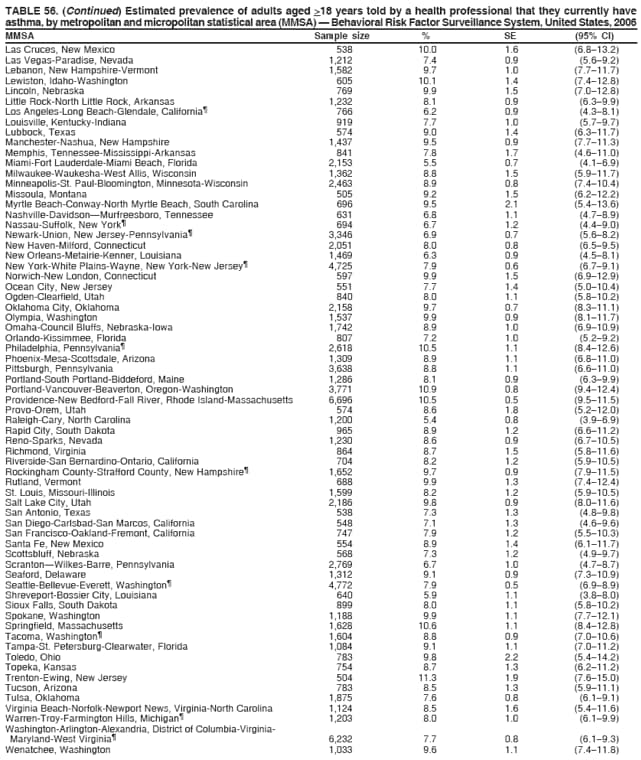  Return to top. Table 57 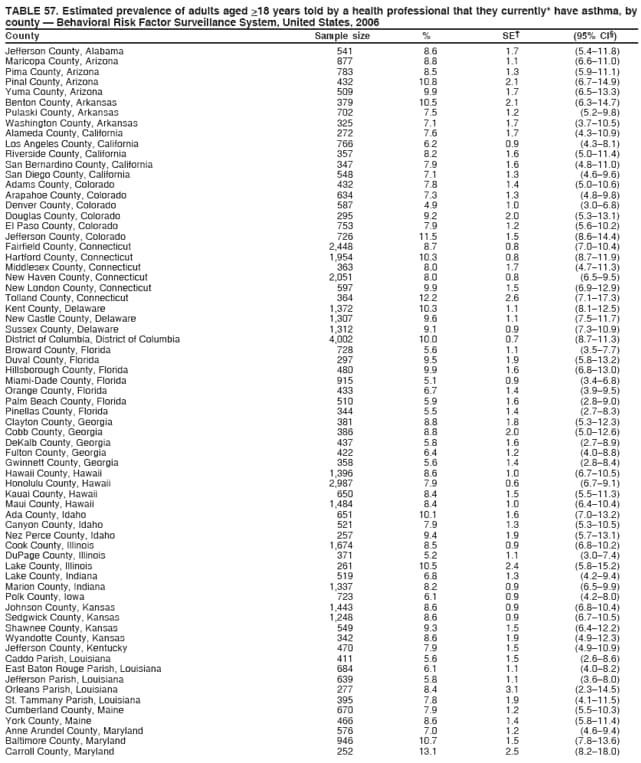 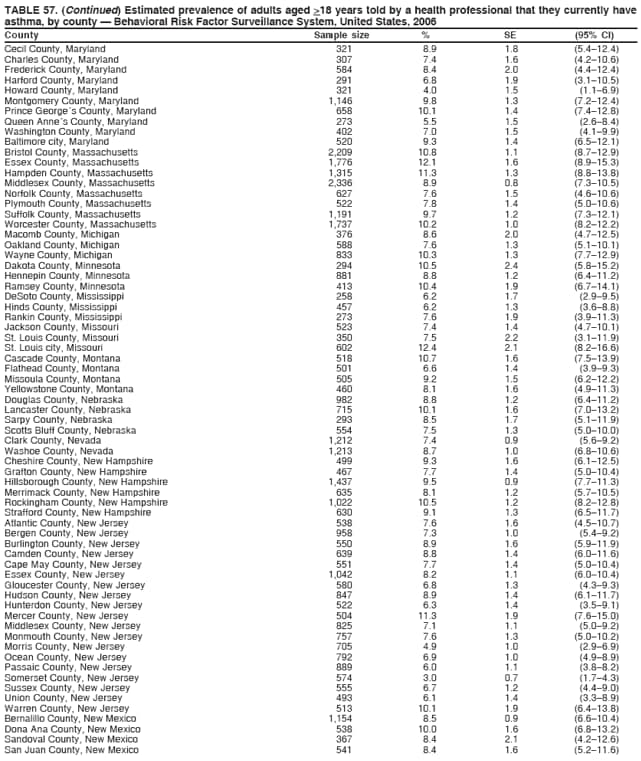 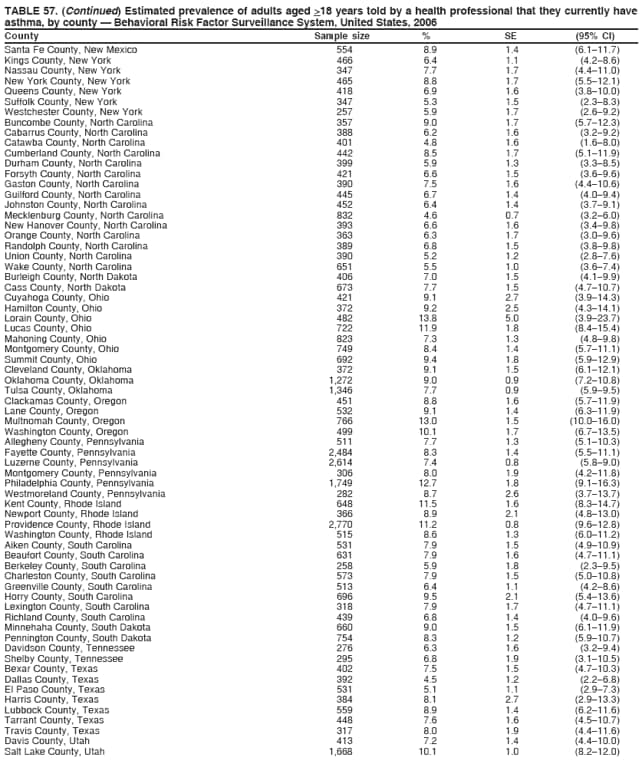 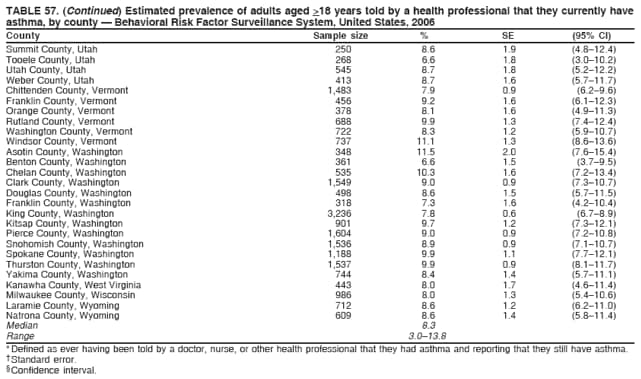 Return to top. Table 58 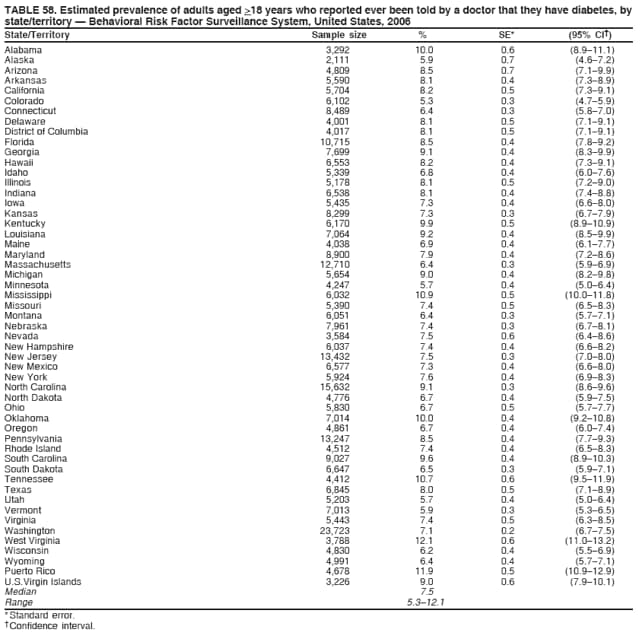 Return to top. Table 59 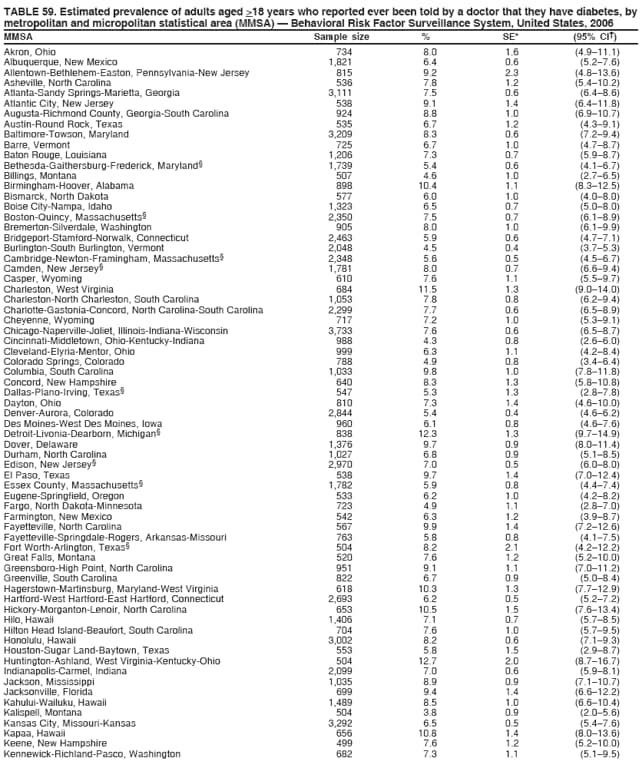 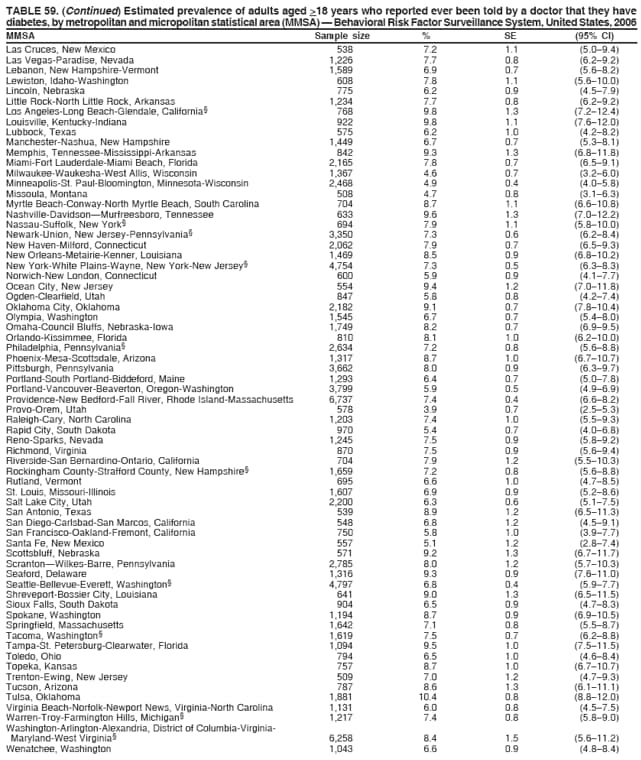  Return to top. Table 60 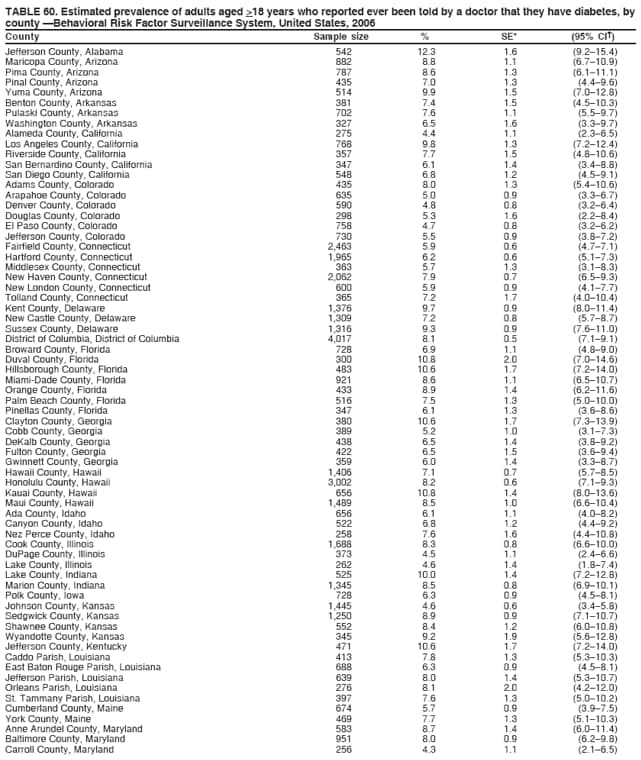 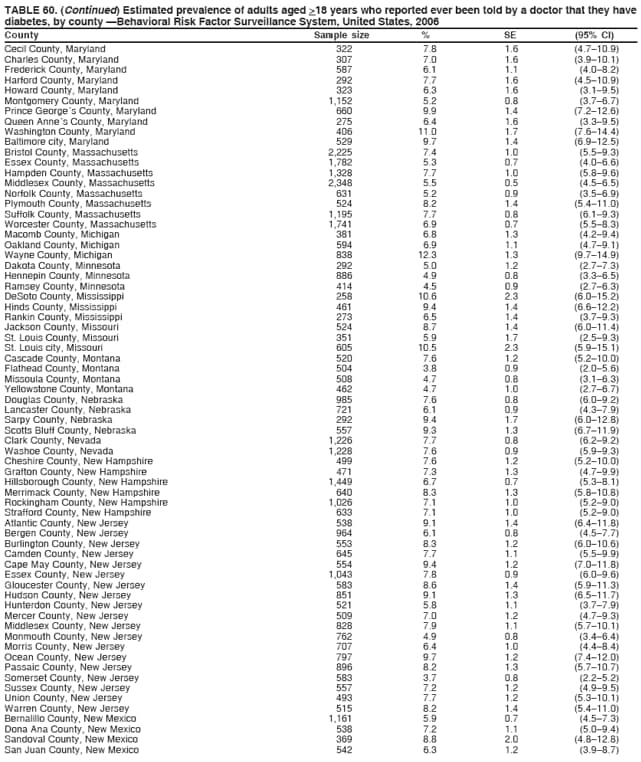 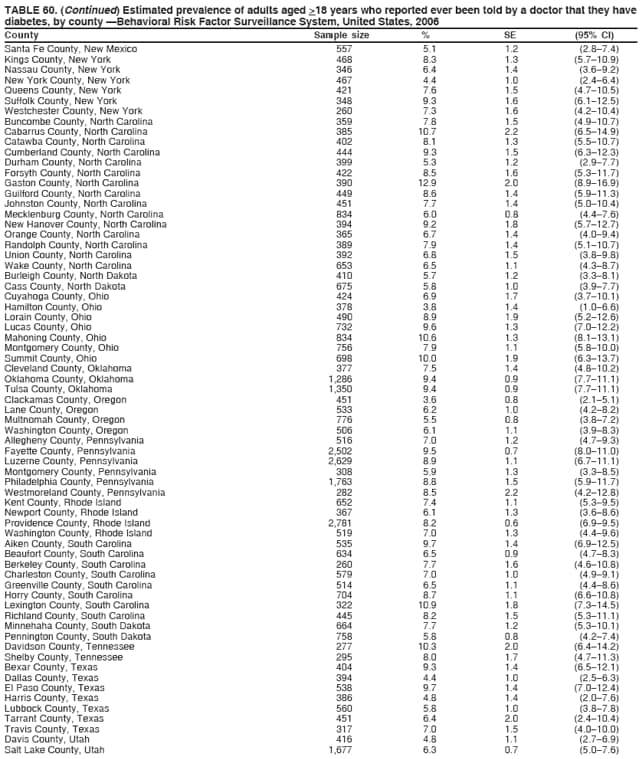 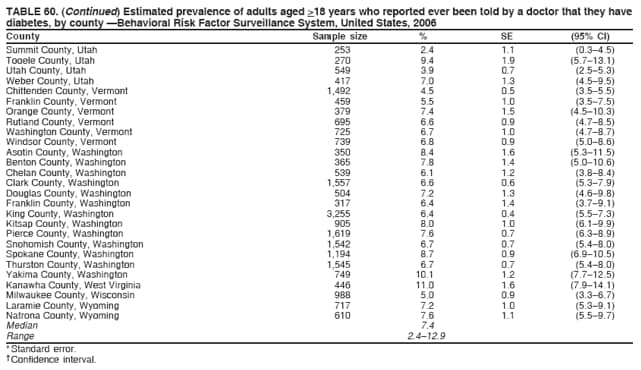 Return to top. Table 61 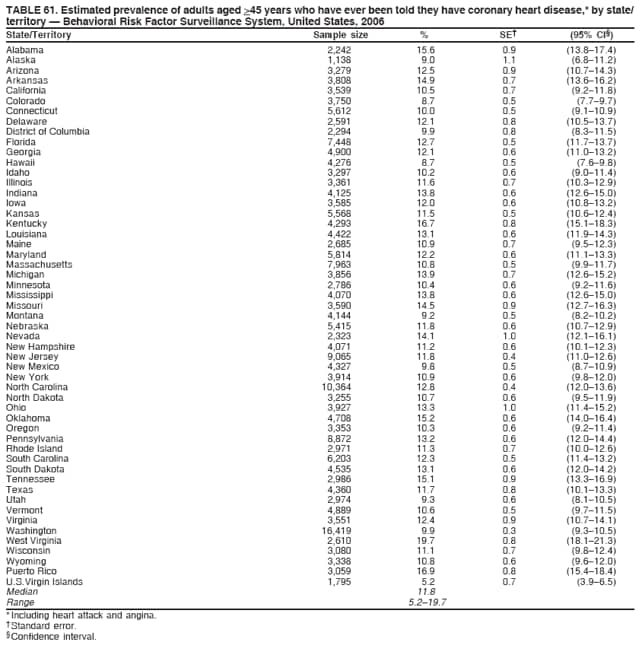 Return to top. Table 62 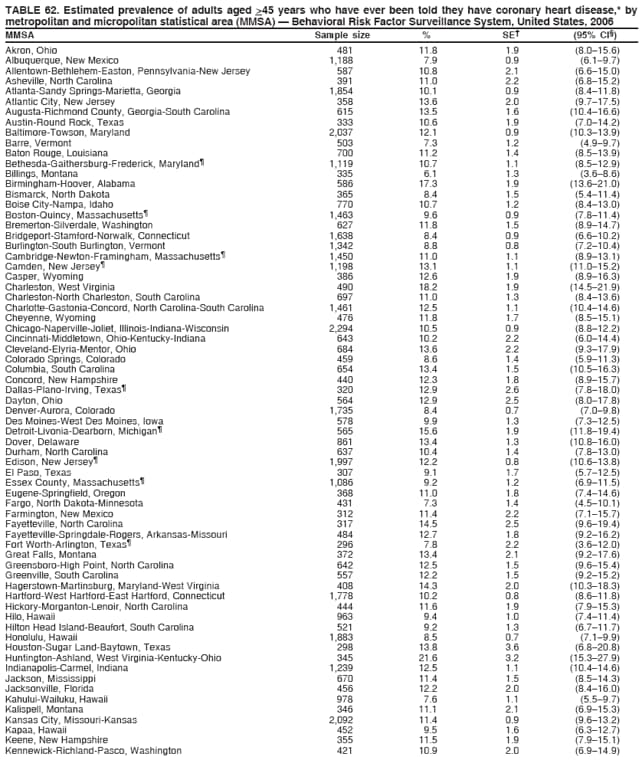 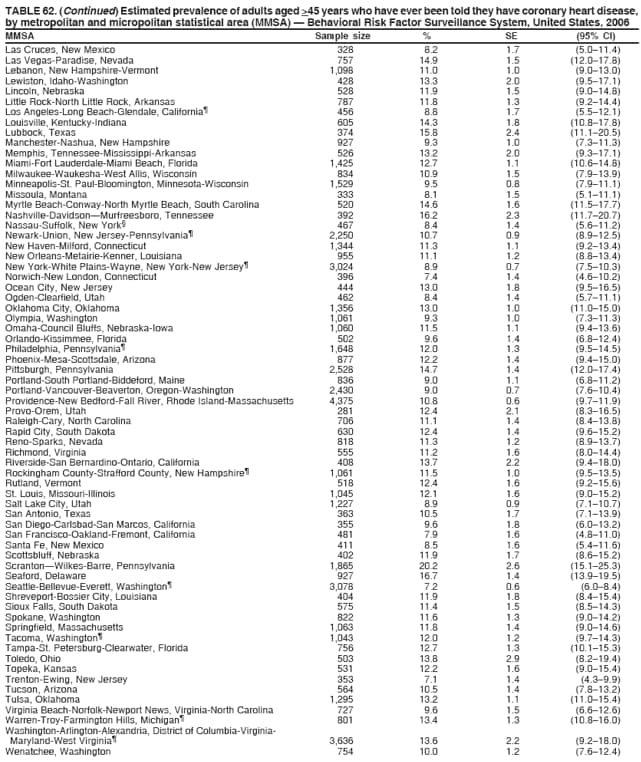  Return to top. Table 63 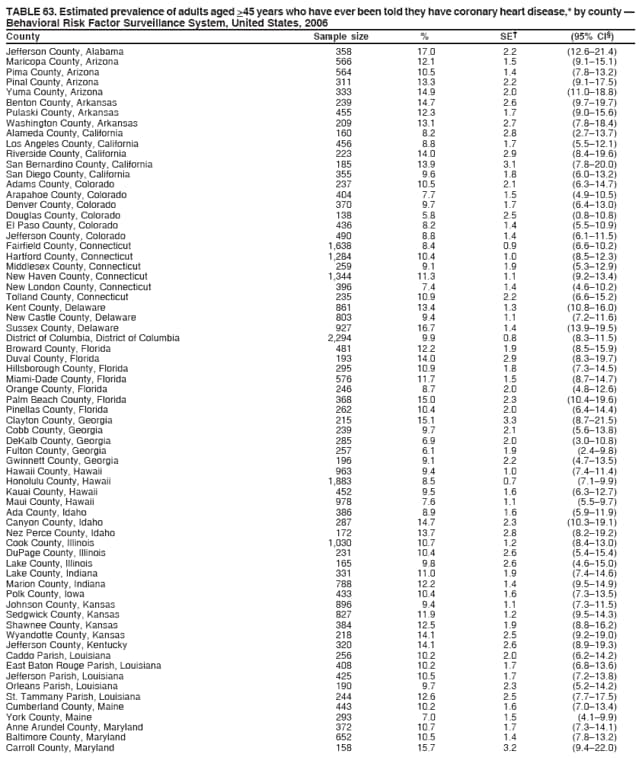 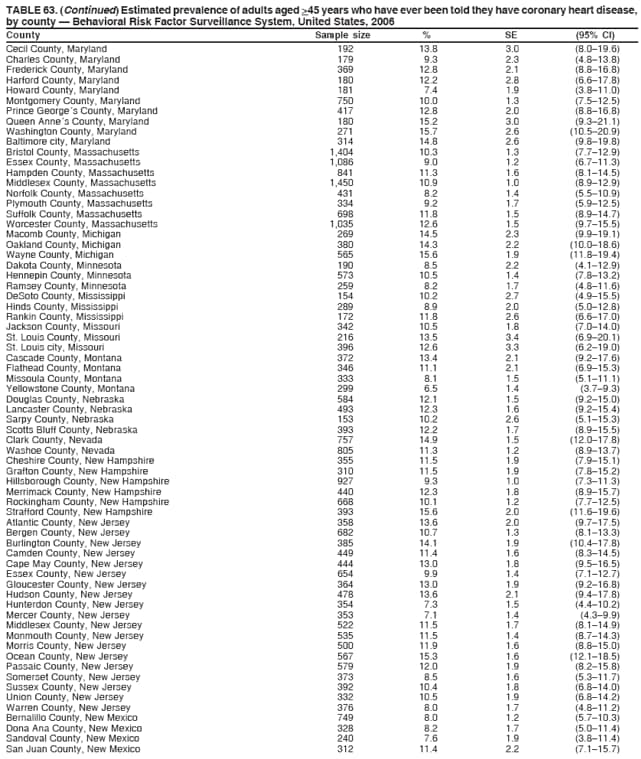 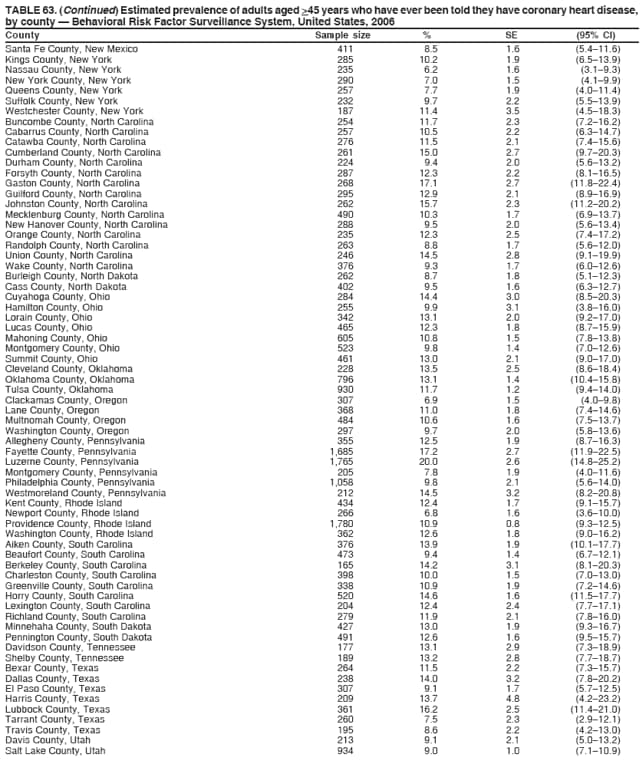 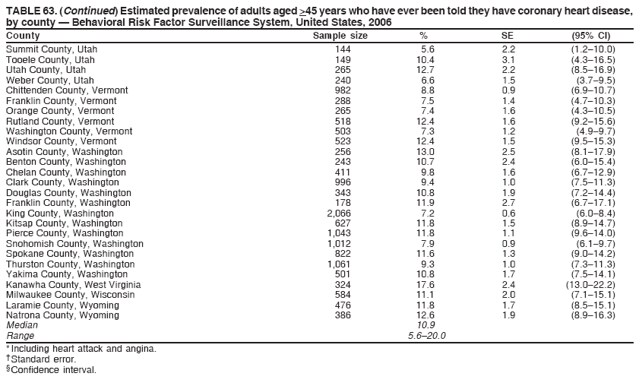 Return to top. Table 64 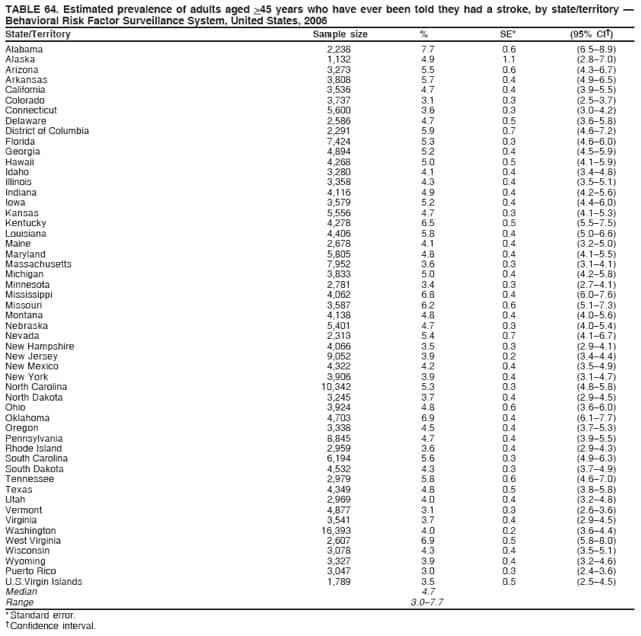 Return to top. Table 65 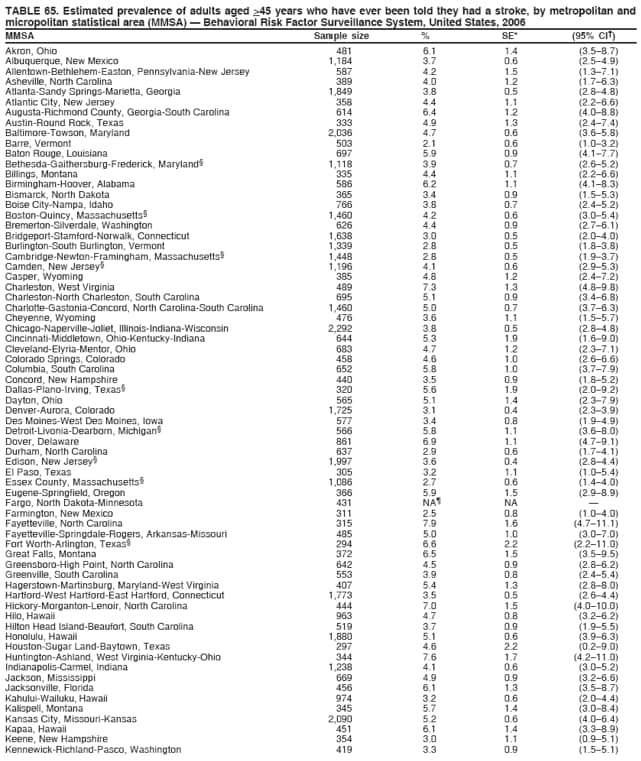 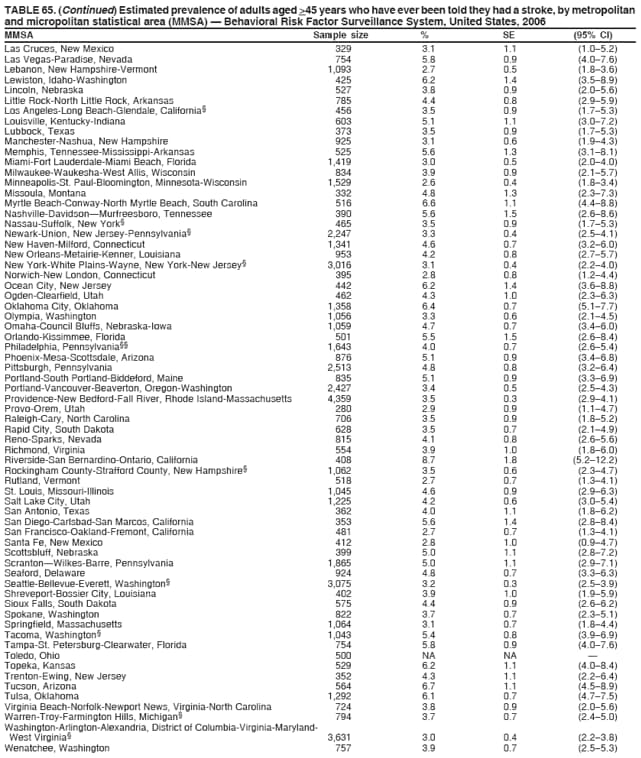  Return to top. Table 66 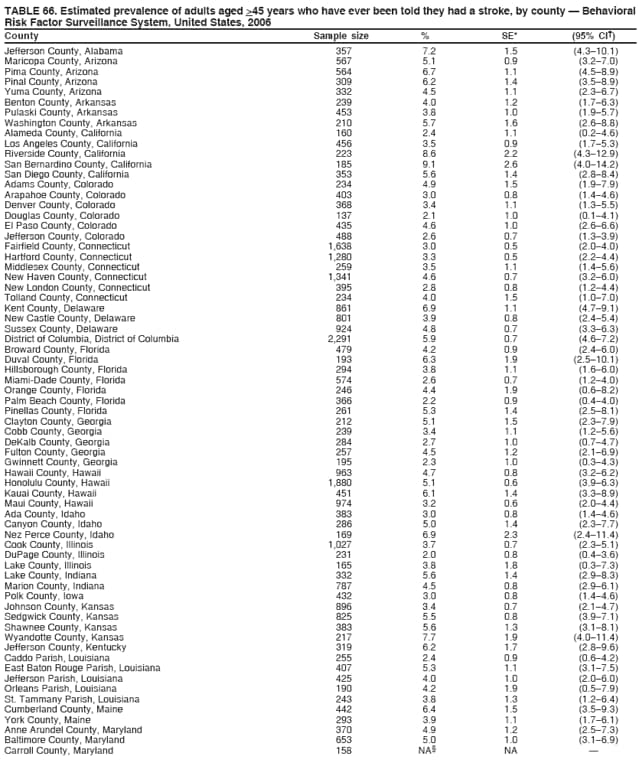 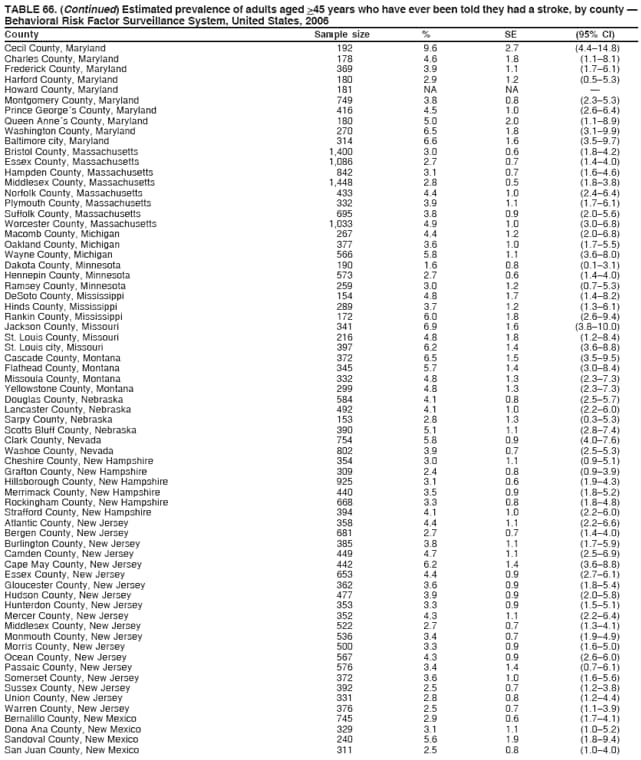 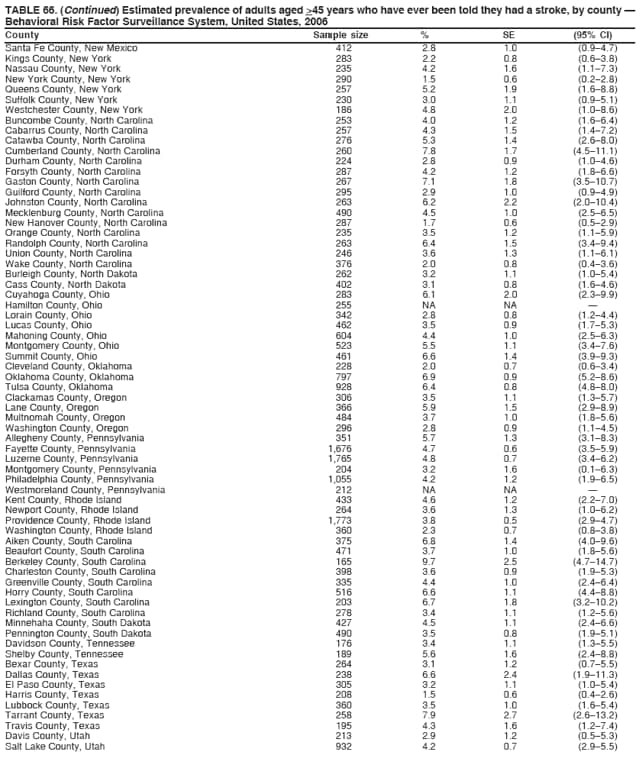 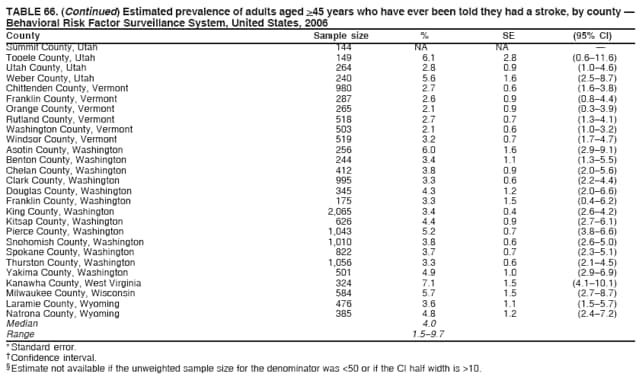 Return to top. Table 67 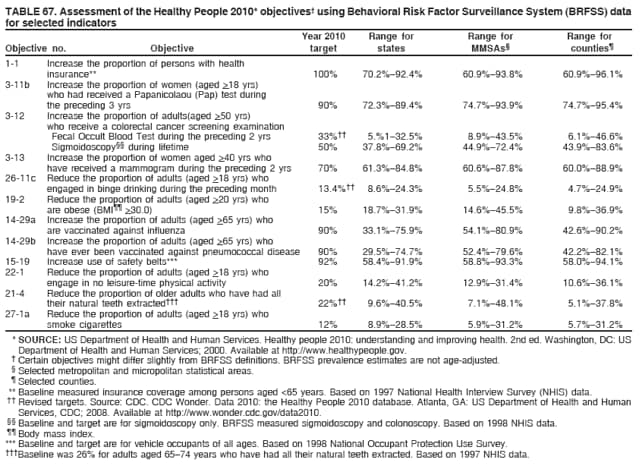 Return to top.
All MMWR HTML versions of articles are electronic conversions from typeset documents. This conversion might result in character translation or format errors in the HTML version. Users are referred to the electronic PDF version (http://www.cdc.gov/mmwr) and/or the original MMWR paper copy for printable versions of official text, figures, and tables. An original paper copy of this issue can be obtained from the Superintendent of Documents, U.S. Government Printing Office (GPO), Washington, DC 20402-9371; telephone: (202) 512-1800. Contact GPO for current prices. **Questions or messages regarding errors in formatting should be addressed to [email protected].Date last reviewed: 8/5/2008 |
|||||||||
|