 |
|
|
|
|
|
|
| ||||||||||
|
|
|
|
|
|
|
||||
| ||||||||||
|
|
|
|
|
Persons using assistive technology might not be able to fully access information in this file. For assistance, please send e-mail to: [email protected]. Type 508 Accommodation and the title of the report in the subject line of e-mail. National Bioterrorism Syndromic Surveillance Demonstration ProgramW. Katherine Yih,1 B. Caldwell,2 R. Harmon,3 K. Kleinman,1 R. Lazarus,4 A. Nelson,5 J. Nordin,5 B. Rehm,6 B. Richter,4 D. Ritzwoller,7 E. Sherwood,8,9 R. Platt1,4 1Harvard Medical School/Harvard Pilgrim Health Care, Boston, Massachusetts; 2Division of Healthcare Quality Promotion, National Center for Infectious Diseases, CDC; 3Optum/Ingenix, Eden Prairie, Minnesota; 4Harvard Medical School, Boston, Massachusetts; 5HealthPartners Research Foundation, Minneapolis, Minnesota; 6America's Health Insurance Plans, Washington, D.C.; 7Kaiser Permanente Colorado, Denver, Colorado; 8Austin/Travis County Health and Human Services Department, Austin, Texas; 9Williamson County and Cities Health District, Georgetown, Texas
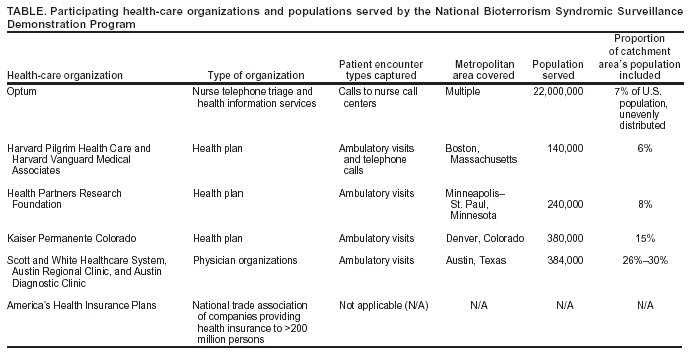
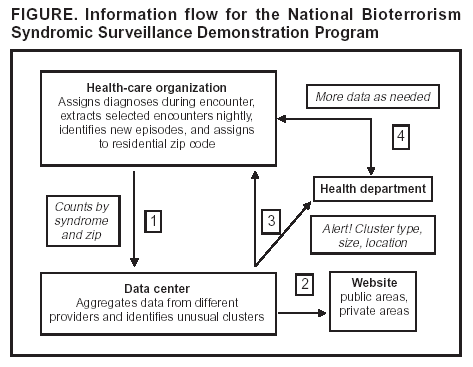
Corresponding author: W. Katherine Yih, Department of Ambulatory Care and Prevention, Harvard Medical School/Harvard Pilgrim Health Care, 133 Brookline Ave., 6th Floor, Boston, MA 02215. E-mail: [email protected]. AbstractThe National Bioterrorism Syndromic Surveillance Demonstration Program identifies new cases of illness from electronic ambulatory patient records. Its goals are to use data from health plans and practice groups to detect localized outbreaks and to facilitate rapid public health follow-up. Data are extracted nightly on patient encounters occurring during the previous 24 hours. Visits or calls with diagnostic codes corresponding to syndromes of interest are counted; repeat encounters are excluded. Daily counts of syndromes by zip code are sent to a central data repository, where they are statistically analyzed for unusual clustering by using a model-adjusted SaTScan™ approach. The results and raw data are displayed on a restricted website. Patient-level information stays at the originating health-care organization unless required by public health authorities. If a cluster surpasses a threshold of statistical aberration chosen by the corresponding public health department, an electronic alert can be sent to that department. The health department might then call a clinical responder, who has electronic access to records of cases contributing to clusters. The system is flexible, allowing for changes in participating organizations, syndrome definitions, and alert thresholds. It is transparent to clinicians and has been accepted by the health-care organizations that provide the data. The system's data are usable by local and national health agencies. Its software is compatible with commonly used systems and software and is mostly open-source. Ongoing activities include evaluating the system's ability to detect naturally occurring outbreaks and simulated terrorism events, automating and testing alerts and response capability, and evaluating alternative data sources. IntroductionThe National Bioterrorism Syndromic Surveillance Demonstration Program covers a population of >20 million persons, monitoring and analyzing numbers of new cases of illness derived from electronic patient-encounter records from participating health-care organizations. It was created on the premise that early detection of acute illness in populations would be useful to public health and that primary care sites and nurse call centers might register the first evidence of such conditions. This CDC-funded program grew out of collaborative projects between multiple health plans and their respective state health departments (1--3). It currently includes eight health-care organizations (Table). The coordinating center, referred to as the data center, is run by Harvard Medical School and Harvard Pilgrim Health Care. Elements of the program have been described elsewhere (4,5). ObjectivesThe program's primary goal is to create a flexible, open-source surveillance system that uses ambulatory care data to identify unusual clusters of illness and support rapid public health follow-up. Secondary goals are to 1) reduce barriers to private health-care organizations' voluntary participation, 2) develop and test optimal signal-detection methods, and 3) develop communication and response methods that enable local public health agencies to obtain detailed clinical information about cases that are part of clusters. System OperationData Sources and Processing at Data-Providing SitesData on patient encounters (visits or calls), including demographic information and diagnostic codes, are recorded electronically at each health-care organization as part of routine patient care, usually on the same day as the visit or call (Figure). Each night, patient encounters with codes of interest are extracted automatically from clinical data systems. The extracted encounter files are created to uniform specifications and are kept on a directory accessible to software (the console) provided by the data center. The console maps patient encounters to syndromes (e.g., respiratory) defined by a CDC-led working group (6) and then identifies illness episodes by omitting patient encounters in any syndrome that occurred within 42 days of an earlier visit in the same syndrome. Episodes are mapped to patients' residential zip codes, and a single file is created containing counts of new episodes in each syndrome and zip code for each day. In addition, historic episode files are created and provide a basis for modeling. Transmission of count data to the data center in extensible markup language (XML) format is safeguarded by means of electronic security certificates and encryption. During the processing of encounter files into episode files, the console produces encounter lists containing demographic and clinical information that remain at the originating site, where they are available in the event of a query from public health authorities. Statistical AnalysisFor each syndrome and clinical site, daily counts are modeled over a multiyear period, and clusters are evaluated by using a model-adjusted SaTScan™ approach, which scans multiple contiguous zip codes over a specified number of consecutive days of surveillance (7,8). SaTScan is adjusted by using generalized linear mixed models that take into account day of the week, holidays, seasons, secular trends, and the unique characteristics of each zip code area, based upon historic data (9). The recurrence interval (i.e., the number of days between predicted occurrences by chance alone within each organization's catchment area) is used to characterize the degree of statistical aberration of any cluster in the contemporary daily episode data. It is the inverse of the cluster's p-value. Thus, the larger the value of the measure, the rarer (and possibly more worthy of investigation) the cluster is. Data Display, Alerts, and ResponseAlmost immediately upon receipt, raw data and modeled results are displayed in table, graph, and map form on a restricted website designed and administered by the data center. If a signal exceeds the threshold of statistical aberration specified by the public health department in whose jurisdiction it occurs, the data center will automatically send an electronic alert to designated persons at the health department. This system is being implemented first in Massachusetts, using the state's electronic health alert network. If contacted by the health department, the clinical organization's responder can provide detailed clinical information about persons in the cluster. System ExperienceValidity for Detection of Naturally Occurring OutbreaksIn November 2003, the system detected unusual respiratory illness clusters in Colorado, Texas, and Massachusetts heralding early severe influenza outbreaks, at least in Colorado. An evaluation is being conducted of the system's ability to detect naturally occurring outbreaks of gastrointestinal illness on the basis of known outbreaks identified by the Minnesota health department. Data Quality Potentially Affecting ValidityThe proportion of the population covered by the surveillance system for different metropolitan areas is provided (Table). Persons without health insurance are not represented. Historic comparisons and simulations are being conducted to assess the minimum proportion of an area's population needed by the surveillance system to detect outbreaks of different types and sizes. UsefulnessThe system's performance in apprehending the 2003 influenza outbreak in Colorado and clusters of gastrointestinal illness in Minnesota is being evaluated. Extensive simulation is also being conducted to describe sensitivity to potential acts of biologic terrorism. Usefulness in practice will be assessed systematically in collaboration with health departments after the alerting system has operated for 1 year in at least one state. FlexibilityThe system is highly adaptable. Alert thresholds can be set at any degree of statistical aberration, can be different for different syndromes and in different locales, and can be changed. Different statistical methods can be applied to the counts by date, syndrome, and zip code. With the consent of the organizations that hold the data, new syndromes categories can easily be created, and customized queries of the originally extracted encounters (encompassing approximately 700 International Classification of Diseases, Ninth Revision [ICD-9] codes) are feasible. Acceptability and CostThe system entails no extra work for clinicians. Because patient-level data stay with the organization and are shared only when a public health need exists, the system's distributed-data model has been accepted by participating health-care organizations. Health plans consider the aggregate data to be either de-identified or limited data sets as defined by the Health Insurance Portability and Accountability Act of 1996 (HIPAA) Privacy Rule. Additionally, they consider this aggregated-data model to allow them greater control over their proprietary information. Resources needed by clinical organizations include a networked Microsoft Windows® personal computer (or comparable) with Internet access, system administrator effort to create the routine data extract from host systems and to maintain connectivity, project programmer effort to install and run programs, administrative effort to review and approve new software updates before they are installed on local computers and to develop communication and response protocols with health agencies, and clinical responder training and availability. Because organizations' cost structures vary widely, predicting actual costs is difficult. Openness, Compatibility, and PortabilityThe program is designed to be open, maximally compatible with elements of commonly used surveillance systems, and easy for additional health-care organizations to join. Syndrome definitions of the CDC-led working group (6) and open-source software and development are used wherever possible, and all protocols and computer code are available to other investigators and public health agencies. Health-care organizations use software provided by the project (written in Python [http://www.python.org]) that can run on the majority of common operating systems, including Windows,® Macintosh,® and Linux,® to process their own data for transmission to the data center. Uniform file specifications and console-based uploading allow the system to work at virtually any site where diagnostic codes are available electronically on the day of encounter. Data files created by this system are also directly usable by health departments and are compatible with the emerging standards of CDC's BioSense initiative (10). This allows health-care organizations to make their data directly available to local and national health agencies if they so choose. Acknowledgments This work has been supported by CDC cooperative agreement UR8/CCU115079; Massachusetts Department of Public Health contracts 5225 4 160002, 5223 3 160001, and 5225 3 337HAR; Minnesota Department of Health contract A57182; and a grant awarded by the Texas Association of Local Health Officials. The Colorado Department of Public Health and Environment, Austin/Travis County Health and Human Services Department, and Williamson County and Cities Health District have provided in-kind support. References
Table  Return to top. Figure  Return to top.
Disclaimer All MMWR HTML versions of articles are electronic conversions from ASCII text into HTML. This conversion may have resulted in character translation or format errors in the HTML version. Users should not rely on this HTML document, but are referred to the electronic PDF version and/or the original MMWR paper copy for the official text, figures, and tables. An original paper copy of this issue can be obtained from the Superintendent of Documents, U.S. Government Printing Office (GPO), Washington, DC 20402-9371; telephone: (202) 512-1800. Contact GPO for current prices. **Questions or messages regarding errors in formatting should be addressed to [email protected].Page converted: 9/14/2004 |
|||||||||
This page last reviewed 9/14/2004
|