Receipt of Family Planning Services in the United States: 2022–2023
- Key findings
- In 2022‒2023, about one out of three females received a family planning service in the past 12 months.
- In 2022–2023, receipt of family planning services in the past 12 months varied by age.
- Receipt of family planning services in the past 12 months was highest among White, non-Hispanic (subsequently, White) females.
- Receipt of family planning services in the past 12 months varied by family income.
Data from the 2022–2023 National Survey of Family Growth
- During 2022–2023, 35.7% of females ages 15–49 received a family planning service in the past 12 months.
- Receipt of family planning services was highest for women ages 20–29 compared with those in other age groups.
- A higher percentage of White non-Hispanic females received a family planning service compared with Black non-Hispanic and Hispanic females.
- A lower percentage of women ages 22–49 with family incomes less than 150% of the federal poverty level received a family planning service (33.3%) compared with women whose family incomes were 300% or more (37.8%).
- The percentage of women who received a family planning service increased with higher levels of education.
Use of family planning services allows women to achieve their desired birth timing, spacing, and family size (1,2). Women may receive related medical services when they receive family planning services, such as Pap tests (3–6). For others, the family planning services visit may be their only contact with the medical system (3). Inadequate access to family planning services may result in negative health outcomes (3,4,7,8). This report uses data from the 2022–2023 National Survey of Family Growth (NSFG) to estimate receipt of family planning services by selected characteristics among females ages 15–49 in the United States. The most common service received, a birth control method or prescription, is also shown.
Keywords: birth control, contraception, sterilization, National Survey of Family Growth (NSFG)
In 2022‒2023, about one out of three females received a family planning service in the past 12 months.
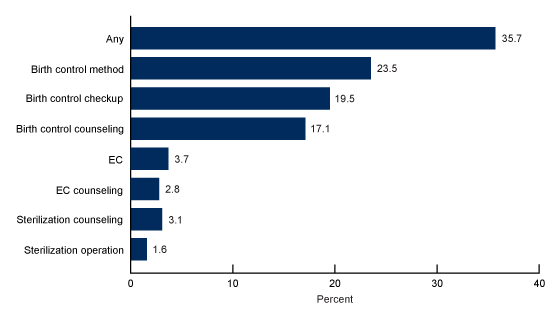
- During 2022–2023, 35.7% of females ages 15–49 received any family planning service in the past 12 months (Figure 1, Table 1).
- In 2022–2023, 23.5% of females received a birth control method or prescription.
- In 2022–2023, 1.6% of females received a sterilization operation in the past 12 months.
- A total of 3.7% of females received emergency contraception and 2.8% received counseling for emergency contraception.
Figure 1. Percentage of females ages 15–49 who received any family planning service from a medical care provider in the past 12 months: United States, 2022–2023
NOTE: EC is emergency contraception.
SOURCE: National Center for Health Statistics, National Survey of Family Growth, 2022–2023.
In 2022–2023, receipt of family planning services in the past 12 months varied by age.
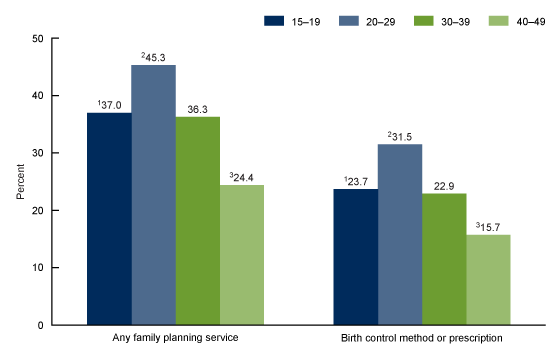
- In 2022–2023, a higher percentage of women ages 20–29 received a family planning service in the past 12 months (45.3%) than females ages 15–19 (37.0%), 30–39 (36.3%), and 40–49 (24.4%) (Figure 2, Table 2). Receipt of a family planning service was lowest among women ages 40–49.
- A higher percentage of women ages 20–29 received a birth control method or a prescription (31.5%) than females ages 15–19 (23.7%), 30–39 (22.9%), and 40–49 (15.7%). Receipt of a birth control method or prescription was lowest among women ages 40–49.
Figure 2. Percentage of females ages 15‒49 who received any family planning service or a birth control method or prescription from a medical care provider in the past 12 months, by age: United States, 2022‒2023
1Significant quadratic trend by age (p < 0.05).
2Significantly different from ages 15–19, 30–39, and 40–49 (p < 0.05).
3Significantly different from all the other age groups (p < 0.05).
SOURCE: National Center for Health Statistics, National Survey of Family Growth, 2022‒2023.
Receipt of family planning services in the past 12 months was highest among White, non-Hispanic (subsequently, White) females.
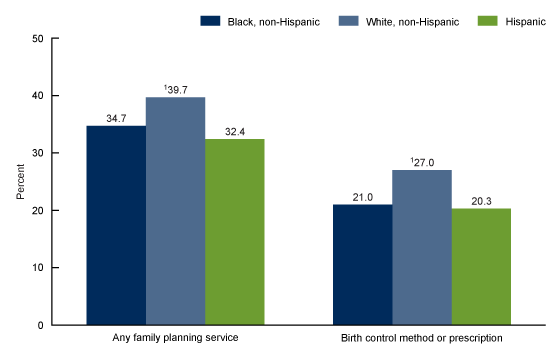
- In 2022–2023, a higher percentage of White females ages 15–49 received any family planning service in the past 12 months (39.7%) compared with Black non-Hispanic (subsequently, Black) (34.7%) and Hispanic (32.4%) females (Figure 3, Table 3).
- A higher percentage of White females (27.0%) received a birth control method or prescription compared with Black (21.0%) and Hispanic (20.3%) females.
Figure 3. Percentage of females ages 15‒49 who received any family planning service or a birth control method or prescription from a medical care provider in the past 12 months, by race and Hispanic origin: United States, 2022‒2023
1Significantly different from Black non-Hispanic and Hispanic females (p < 0.05).
NOTE: People of Hispanic origin may be of any race.
SOURCE: National Center for Health Statistics, National Survey of Family Growth, 2022‒2023.
Receipt of family planning services in the past 12 months varied by family income.
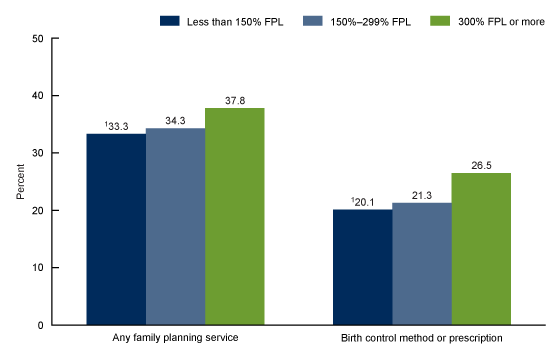
- In 2022–2023, the percentage of women ages 22–49 who received any family planning service in the past 12 months increased with family income, from 33.3% for women with family incomes less than 150% of the federal poverty level to 37.8% for women with family incomes of 300% or more (Figure 4, Table 4).
- The percentage of women who received a birth control method or prescription increased with family income, from 20.1% for women with family incomes less than 150% of the federal poverty level to 26.5% for women with family incomes of 300% or more.
Figure 4. Percentage of women ages 22‒49 who received any family planning service or a birth control method or prescription from a medical care provider in the past 12 months, by family income: United States, 2022‒2023
1Significant linear trend by family income as a percentage of federal poverty level (p < 0.05).
NOTE: FPL is federal poverty level.
SOURCE: National Center for Health Statistics, National Survey of Family Growth, 2022‒2023.
Receipt of family planning services in the past 12 months varied by education.
- In 2022–2023, the percentage of women ages 22–49 who received any family planning service in the past 12 months increased with higher levels of education, from 31.7% among those with a high school education or less to 39.0% among those with a bachelor’s degree or more (Figure 5, Table 5).
- The percentage of women who received a birth control method or prescription increased with higher levels of education, from 20.0% among those with a high school education or less to 26.1% among those with a bachelor’s degree or more.
Figure 5. Percentage of women ages 22‒49 who received any family planning service or a birth control method or prescription from a medical care provider in the past 12 months, by education: United States, 2022‒2023
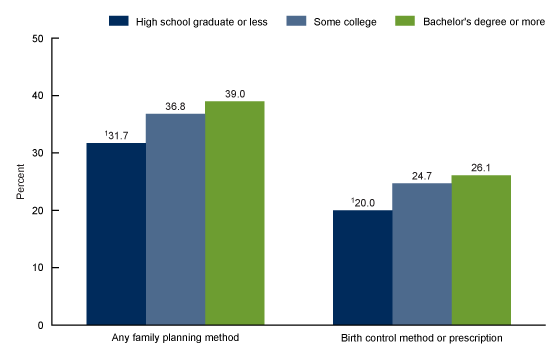
1Significant linear trend by education (p < 0.05).
SOURCE: National Center for Health Statistics, National Survey of Family Growth, 2022‒2023.
Summary
This report updates estimates of receipt of any family planning services in the past 12 months among females ages 15–49 in the United States using NSFG data from 2022–2023. Further estimates of receipt of any family planning services in the past 12 months are presented by age, race and Hispanic origin, education, and family income. About one-third of females ages 15–49 in 2022–2023 received a family planning service (35.7%). In 2022–2023, the most common family planning service received in the past 12 months was a birth control method or prescription. Understanding these patterns in receipt of family planning services could help improve access to and receipt of contraceptive services.
Definitions
Family planning services received: Based on a series of yes or no questions asking the female respondent if she had received any of seven different family planning services in the past 12 months. The services included are: birth control method or prescription, birth control checkup, birth control counseling, emergency contraception, emergency contraception counseling, sterilization counseling, or sterilization operation.
Race and Hispanic origin: Recode variable, HISPRACE2, categorizes non-Hispanic respondents’ race for those who selected only one racial group; respondents had the option to select more than one racial group (9). Respondents categorized as Hispanic may be of any race or combination of races. Estimates for non-Hispanic respondents of races other than White only or Black only are not shown but are included in total estimates. This report presents results in Figure 3 separately only for females who are Hispanic, non-Hispanic White single race, and non-Hispanic Black single race.
Family income as a percentage of federal poverty level: Estimates are based on the federal poverty level, which is calculated from family income and family size using the U.S. Census Bureau’s poverty thresholds for the previous calendar year (10).
Data source and methods
This report is based on data from 5,586 females ages 15–49 interviewed in the 2022–2023 NSFG (11). NSFG is jointly planned and funded by the National Center for Health Statistics and several other programs of the U.S. Department of Health and Human Services. All estimates in this report are weighted to reflect the female household population ages 15–49 of the United States in 2022. The response rate for female respondents in the 2022–2023 NSFG was 23.4% (9,10). The 2022–2023 NSFG shifted to a multimode design, and about 75% of interviews were completed via web, a mode that tends to have a lower response rate than face-to-face interviewing (11). Due to the change in interview mode and decline in response rates, comparisons of these results with previous cycles of NSFG should be made with caution. A more detailed analysis of the potential impact of nonresponse bias is forthcoming. Statistics for this report were produced using the SURVEY procedures in SAS software version 9.4 and SAS-callable SUDAAN software version 11.0.3 (12) to account for the complex sample design of NSFG. Differences between percentages were evaluated using two-tailed t tests at the 0.05 level. No adjustments were made for multiple comparisons. Survey clusters minus strata were used as the degrees of freedom for significance testing of pairwise comparisons. Linear and quadratic trends by age group, education, and family income were evaluated using orthogonal polynomials in logistic regression. The data presented in this report are bivariate associations that may be explained by other factors not controlled for in the figures or included in the report. All estimates presented meet National Center for Health Statistics data presentation standards for proportions (13).
About the author
Gladys Martinez is with the National Center for Health Statistics, Division of Health Interview Statistics.
References
- Gavin L, Pazol K. Update: Providing quality family planning services—Recommendations from CDC and the U.S. Office of Population Affairs, 2015. MMWR Morb Mortal Wkly Rep 65(9):231–4. 2016.
- Sonfield A, Hasstedt K, Kavanaugh ML, Anderson R. The social and economic benefits of women’s ability to determine whether and when to have children. Guttmacher Institute. 2013.
- Frost JJ, Zolna MR, Frohwirth LF, Douglas-Hall AD, Blades N, Mueller J, et al. Publicly supported family planning services in the United States: Likely need, availability and impact, 2016. Guttmacher Institute. 2019.
- Hall KS, Moreau C, Trussell J. Discouraging trends in reproductive health service use among adolescent and young adult women in the USA, 2002–2008. Hum Reprod 26(9):2541‒8. 2011. DOI: https://www.dx.doi.org/10.1093/humrep/der184.
- Darroch JE, Frost JJ, Singh S. Teenage sexual and reproductive behavior in developed countries: Can more progress be made? Guttmacher Institute. 2001.
- Martinez GM, Chandra A, Febo-Vazquez I, Mosher WD. Use of family planning and related medical services among women aged 15–44 in the United States: National Survey of Family Growth, 2006–2010. National Health Statistics Reports; no 68. Hyattsville, MD: National Center for Health Statistics. 2013.
- Clochard A, Killewald P, Larson A, Leith W, Paxton N, Troxel J, Wong M. Family planning annual report: 2022 national summary. Office of Population Affairs, Office of the Assistant Secretary for Health, Department of Health and Human Services. 2023.
- Dehlendorf C, Rodriguez MI, Levy K, Borrero S, Steinauer J. Disparities in family planning. Am J Obstet Gynecol 202(3):214‒20. 2010.
- Office of Management and Budget. Revisions to the standards for the classification of federal data on race and ethnicity. Fed Regist 62(210):58782–90. 1997.
- U.S. Census Bureau. Poverty thresholds. 2023.
- National Center for Health Statistics. National Survey of Family Growth, 2022–2023 user’s guide. 2024.
- RTI International. SUDAAN (Release 11.0.3) [computer software]. 2018.
- Parker JD, Talih M, Malec DJ, Beresovsky V, Carroll M, Gonzalez JF Jr, et al. National Center for Health Statistics data presentation standards for proportions. National Center for Health Statistics. Vital Health Stat 2(175). 2017.
Suggested citation
Martinez GM. Receipt of family planning services in the United States: 2022–2023. NCHS Data Brief, no 520. Hyattsville, MD: National Center for Health Statistics. 2024. DOI: https://dx.doi.org/10.15620/cdc/169629.
Copyright information
All material appearing in this report is in the public domain and may be reproduced or copied without permission; citation as to source, however, is appreciated.
National Center for Health Statistics
Brian C. Moyer, Ph.D., Director
Amy M. Branum, Ph.D., Associate Director for Science
Division of Health Interview Statistics
Stephen J. Blumberg, Ph.D., Director
Anjel Vahratian, Ph.D., M.P.H.,Associate Director for Science