 |
|
|
|
|
|
|
| ||||||||||
|
|
|
|
|
|
|
||||
| ||||||||||
|
|
|
|
|
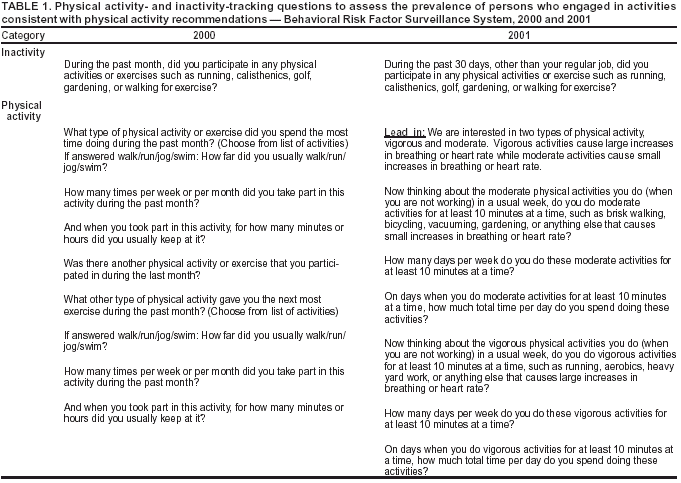
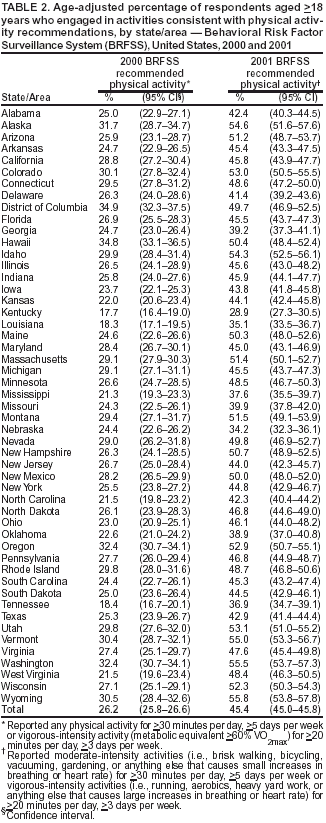
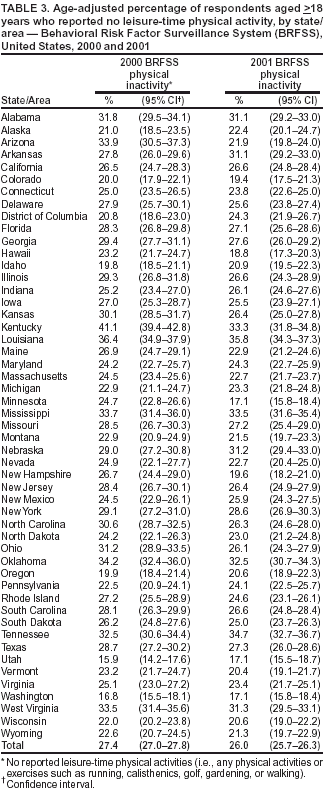
Persons using assistive technology might not be able to fully access information in this file. For assistance, please send e-mail to: [email protected]. Type 508 Accommodation and the title of the report in the subject line of e-mail. Prevalence of Physical Activity, Including Lifestyle Activities Among Adults --- United States, 2000--2001Regular physical activity helps prevent obesity, heart disease, hypertension, diabetes, colon cancer, and premature mortality (1). During 1986--2000, the Behavioral Risk Factor Surveillance System (BRFSS) included questions that measured leisure-time physical activity (primarily exercise or sports-related activities). Previous guidelines for appropriate physical activity to increase cardiorespiratory fitness included participating in vigorous-intensity activity (i.e., >20 minutes per day, >3 days per week) (2). BRFSS questions used to measure this level of activity were developed a decade before CDC and the American College of Sports Medicine concluded that health-related benefits could accrue from a minimum of 30 minutes of moderate-intensity activity on most days of the week (3). Various household and transportation-related physical activities and some leisure-time activities, therefore, can be important to measure (4). In response to expanded activity recommendations designed to include health-related lifestyle activities, new BRFSS physical activity questions have been developed. After cognitive, validity, and reliability testing, the new lifestyle activity questions were used in the 2001 BRFSS. A separate question allowed tracking of physical inactivity during leisure time across years and was used in the 2000 and 2001 BRFSS questionnaires (5). This report presents data from responses to the 2000 BRFSS leisure-time activity questions and the updated lifestyle activity questions of the 2001 BRFSS to compare overall U.S. and state-specific prevalence estimates for adults who engaged in physical activities consistent with recommendations from both survey years. The findings indicate that even with a more complete measure of physical activity than used previously, the majority of U.S. adults are not physically active at levels that can promote health. BRFSS is a population-based, random-digit--dialed telephone survey of the civilian, noninstitutionalized U.S. population aged >18 years in the 50 states, the District of Columbia, Guam, Puerto Rico, and the U.S. Virgin Islands. Physical activity data were analyzed from the 2000 (n = 180,244; response rate: 48.9%) and 2001 BRFSS (n = 205,140; response rate: 51.1%) (6,7). In 2000, BRFSS respondents were asked to report frequency and duration of the two most common leisure-time physical activities or exercise in which they participated during the preceding month (Table 1). Vigorous-intensity activities were defined as activities consistent with the metabolic equivalent of >60% VO2max (5); all other activities were classified as moderate-intensity. In 2001, BRFSS respondents were asked to recall overall frequency and duration of time spent in household, transportation, and leisure-time activities of moderate-intensity (e.g., vacuuming, gardening, brisk walking, or bicycling) and of vigorous intensity (e.g., running, aerobics, or heavy yard work) in a usual week (Table 1). Intensity was self-ascribed and defined by using a lead-in statement to the questions. Respondents were asked whether activities in which they participated caused "large" (vigorous) or "small" (moderate) changes in breathing and heart rate. Respondents were classified as active at the recommended level if they reported sufficient physical activities of moderate intensity (i.e., >30 minutes per day, >5 days per week) or of vigorous intensity (i.e., >20 minutes per day, >3 days per week). The 2001 BRFSS estimates provide the current baseline for states. In 2000 and 2001, a tracking question was used to quantify physical inactivity (Table 1). In the 2000 BRFSS, the inactivity question immediately preceded other physical activity questions and specifically referred to leisure-time activities. In the 2001 BRFSS, the inactivity question was asked separately and earlier in the survey (i.e., several sections before the lifestyle physical activity questions) to reduce recall bias. Because of its placement, the wording was changed to include the phrase "other than your regular job." Data were adjusted for nonresponses, age-adjusted to the 2000 U.S. standard population, and weighted to provide state and overall estimates. Confidence intervals were calculated by using SUDAAN to adjust for the complex survey sample design. The new 2001 lifestyle activity questions classified more persons in the United States as physically active than did the 2000 leisure-time activity questions. In 2000, a total of 26.2% of adults engaged in activities consistent with the physical activity recommendations, compared with 45.4% in 2001 (Table 2). Physical inactivity, measured by the same tracking question, was similar in 2000 (27.4%) and in 2001 (26.0%) (Table 3). In 2001, the state-specific percentage of adults who engaged in activities consistent with the physical activity recommendations ranged from 28.9% to 55.8%. State-specific estimates for physical inactivity remained similar during 2000--2001; absolute differences ranged from 0.1% to 12.0%. Reported by: CA Macera, PhD, San Diego State Univ, San Diego, California. DA Jones, PhD, MM Yore, MSPH, SA Ham, MS, HW Kohl, PhD, CD Kimsey, Jr, PhD, D Buchner, MD, Div of Nutrition and Physical Activity, National Center for Chronic Disease Prevention and Health Promotion, CDC. Editorial Note:The findings in this report indicate that the majority of U.S. adults were not physically active on a regular basis in 2000 or 2001. Because of changes to the 2001 BRFSS survey, the difference in the proportion of adults who engaged in activities consistent with physical activity recommendations during 2000--2001 might not reflect an actual increase in physical activity. The percentage of adults who obtained the recommended level of physical activity, as indicated by responses to the 2001 questions, increased for several reasons. First, the new 2001 lifestyle activity questions covered more activity domains (e.g., household, transportation, and leisure-time); the 2000 questions covered only the leisure-time domain. Second, the new 2001 lifestyle activity questions attempted to profile the activities in a usual week rather than reporting the top two activities during the preceding month; therefore, less frequent activities that might not have been mentioned in the 2000 question format could be included in the 2001 overall activity profile. Finally, in 2001, respondents were asked specifically to recall moderate- and vigorous-intensity activities separately, thereby increasing the potential to recall less intense lifestyle activities. The findings in this report are subject to at least five limitations. First, BRFSS is based on self-reported data and is subject to recall bias. Second, although the new 2001 lifestyle activity questions covered more activity domains than previous BRFSS questions, the domains cannot be considered separately with these few questions. Third, expanding the scope of questions to include more activities and intensity levels provides less information about particular activities. For example, time spent specifically walking or running was not determined. Fourth, the 2001 questionnaire is not designed to assess whether a combination of moderate- and vigorous-physical activity might classify persons as active, because it was not possible to determine whether the moderate and vigorous activities occurred on different days. Therefore, a small proportion of active persons might have been misclassified as not participating in activities consistent with physical activity recommendations. Finally, response rates might have affected estimates. The number of interviews completed in 2001 ranged from 8,628 in Massachusetts to 871 in Guam; the Council of American Survey Research Organizations response rates for states and territories in the 2001 BRFSS ranged from 81.5% in Puerto Rico to 33.3% in New Jersey (6). The median response rate for the 2001 BRFSS was 51.1%. However, BRFSS data have minimal bias compared with census data. In addition, BRFSS data for select health behaviors and health status measures have moderate-to-high reliability and validity (8). The majority of persons in the United States do not engage in physical activities consistent with the recommendation of a minimum of 30 minutes of moderate-intensity activity on most days of the week. In 2001, a total of 54.6% of persons were not active enough to meet these recommendations. By incorporating lifestyle physical activity measurements in the 2001 BRFSS, states have an updated baseline for evaluating the effectiveness of public health physical activity interventions. References
Table 1  Return to top. Table 2  Return to top. Table 3  Return to top.
Disclaimer All MMWR HTML versions of articles are electronic conversions from ASCII text into HTML. This conversion may have resulted in character translation or format errors in the HTML version. Users should not rely on this HTML document, but are referred to the electronic PDF version and/or the original MMWR paper copy for the official text, figures, and tables. An original paper copy of this issue can be obtained from the Superintendent of Documents, U.S. Government Printing Office (GPO), Washington, DC 20402-9371; telephone: (202) 512-1800. Contact GPO for current prices. **Questions or messages regarding errors in formatting should be addressed to [email protected].Page converted: 8/14/2003 |
|||||||||
This page last reviewed 8/14/2003
|