 |
|
|
|
|
|
|
| ||||||||||
|
|
|
|
|
|
|
||||
| ||||||||||
|
|
|
|
|
Persons using assistive technology might not be able to fully access information in this file. For assistance, please send e-mail to: [email protected]. Type 508 Accommodation and the title of the report in the subject line of e-mail. Surveillance for Traumatic Brain Injury Deaths --- United States, 1989--1998Nelson Adekoya, Dr.P.H.1 Abstract Problem/Condition: Data indicate that approximately 50,000 U.S. residents die as a result of traumatic brain injury (TBI) annually. Survivors of TBI are often left with neuropsychologic impairments that result in disabilities affecting work or social activity. During 1979--1992, TBI-related death rates declined 22%, from 24.6 to 19.3 deaths/100,000 population. This report describes the epidemiology and trends in TBI-related mortality during 1989--1998. Reporting Period: January 1, 1989--December 31, 1998. Description of Systems: The National Center for Health Statistics (NCHS) Multiple Cause of Death public use data were analyzed for this study. Results: During 1989--1998, an annual average of 53,288 deaths (range: 51,848--54,501) among U.S. residents were associated with TBI. TBI-related death rates declined 11.4%, from 21.9 to 19.4/100,000 population. The major causes of TBI-related deaths were firearm-related (40%), motor-vehicle--related (34%), and fall-related (10%). The leading causes of TBI-related deaths differed among age groups. Among youths aged 0--19 years, motor-vehicle--related TBIs were the leading cause; among persons aged 20--74 years, firearm-related TBIs were the leading cause; and among persons aged >75 years, fall-related TBIs were the leading cause. Comparing rates in 1989 with rates in 1998, motor-vehicle--related causes declined by 22%; the majority of this decline occurred during the first 5 years of the period. During 1989--1998, firearm-related TBI-related deaths declined by 14%; approximately all of this decline occurred during the last 5 years of the period. In contrast, fall-related TBI-related death rates increased by 25% during the period. Conclusion: This analysis of mortality data identifies recent trends in TBI-related deaths occurring during 1989--1998. Fall-related TBI death rates have increased throughout the period. Firearm-related TBI death rates, which were increasing in the early 1990s, declined. Motor-vehicle--related TBI death rates, which were decreasing until the mid-1990s, have since demonstrated only a limited change. Public Health Action: More current population-based epidemiologic studies of TBI are needed to assess recent trends of etiologic factors, provide additional guidance for public policy, and evaluate prevention strategies. Despite the decline in fatal TBI incidence, TBI morbidity and mortality remains a public health challenge. Public health, law enforcement, and transportation safety professionals can address these challenges by implementing effective interventions based on a thorough assessment of the factors that influence health-related behaviors. IntroductionTraumatic brain injury (TBI) is a major cause of morbidity and mortality in the United States (1--18). Each year, approximately 50,000 deaths in the United States are associated with TBI (19), representing >33% of all injury-related deaths. Among survivors of TBI, neuropsychologic and other disabilities (20) are common and often require extensive rehabilitation services and sometimes long-term care. TBI results in substantial loss to persons, their families, and society (21--23); in 1995, the total direct and indirect financial costs of these injuries were estimated at $56 billion (23). In 1989, the Federal Interagency Head Injury Task Force identified traumatic brain injury as a critical public health problem (24). Since 1989, CDC has published analyses of trends in TBI mortality (1,5,19); the most recent of these indicated that TBI mortality rates decreased from 24.6 to 19.3 deaths/100,000 population during 1979--1992, a decline of 22% (19). This decline in mortality was accompanied by changes in distribution of the major external causes (i.e., the circumstance or environmental event that caused the injury) of TBI-related death, such that firearm-related injury surpassed motor-vehicle--related injury as the leading cause of TBI-related deaths in 1990. In 1995, CDC developed guidelines for surveillance of TBI (25) and, with funding authorized under Public Law 104-166 (the Traumatic Brain Injury Act of 1996), supported development of a multistate TBI surveillance system (26,27). This analysis examines more recent trends in TBI mortality. Specifically, this analysis of mortality data 1) characterizes secular trends of TBI-related deaths during 1989--1998, 2) describes differences in risk for death by age, sex, and race, 3) identifies populations at the greatest risk, and 4) describes trends among the leading external causes of TBI-related death: firearm-related injury, motor-vehicle--related injury crashes, and fall-related injury. Data tabulations are also provided to serve as reference material. MethodsData SourceData from CDC's National Center for Health Statistics (NCHS) Multiple Cause of Death public use data files were analyzed (28) for January 1, 1989--December 31, 1998. These mortality data were compiled from death certificates submitted from the vital records offices of all 50 states and the District of Columbia. Causes of death were recorded on the death certificate by the attending physician, medical examiner, or coroner by using a format specified by the World Health Organization and endorsed by CDC (29). Case DefinitionCases of TBI deaths were identified and selected where >1 diagnostic code representing TBI (25) was included in the sequence of conditions contributing to death. These diagnostic codes comprised the following International Classification of Diseases, 9th Revision (ICD-9) (29) codes:
For injuries and poisoning, ICD-9 (29) specified that the underlying cause is coded rather than the nature of injuries. Therefore, the suffix "-related" was added to describe TBI external causes (e.g., firearm-related, motor-vehicle--related, and fall-related TBIs). The underlying cause of death is defined as 1) the disease or injury that initiated the chain of morbid events leading directly to death or 2) the circumstances of the accident or violence that produced the fatal injury (29). For all deaths, the underlying cause is selected from conditions reported in the medical certification section of the death certificate. Stratifying and Calculating RatesExternal causes of TBI mortality were categorized on the basis of ICD-9 external cause-of-injury codes (i.e., E codes) as follows:
Additionally, reported death rates are further subcategorized for firearm-related injuries: suicide (E955.0--E955.4) and homicide (E965.0--E965.4). Race-specific fatal TBI rates for the three race categories with the highest incidence of TBI (i.e., black, American Indian/Alaska Native, and white) were calculated, as well as sex- and age-specific rates. These rates were based on U.S. resident estimates from population microdata files maintained by the U.S. Bureau of Census for individual years (30). Age-adjusted rates were standardized to U.S. census population estimates for 2000 by direct method. Calculations of age-adjusted and age-specific rates excluded cases with missing age data (N = 511); the latter were included in the calculation of crude rates. Appropriate 95% confidence intervals were calculated for the rates on the basis of standard errors for random variation in the number of deaths each year, as recommended by NCHS (31). Linear regression was used to determine the significance of decline during the interval and the decline of specific external causes of death (e.g., motor-vehicle--related, firearm-related, and fall-related TBIs). Differences with p values <0.05 were considered statistically significant. ResultsTBI-Related Deaths by Age, Sex, and RaceDuring 1989--1998, an annual average of 53,288 deaths among U.S. residents were associated with TBI, for a rate of 20.6/100,000 population (range: 51,848--54,501) (Table 1). During this interval, TBI-related death rates declined 11.4%, from 21.9 to 19.4/100,000 (p < 0.0001). Age Groups The TBI-related death rate for the surveillance period was highest among persons aged >75 years (Figure 1). During 1989--1998, TBI-related death rates declined in all age groups aged <75 years (Table 2), but deaths rates increased for persons aged >75 years from 50.0/100,000 to 60.5/100,000 (21%). Sex The TBI-related death rate was three times higher for males, compared with females, with average annual rates of 33.0 and 9.8/100,000 population, respectively (Table 1). During 1989--1998, TBI-related death rates declined 13% among males (p = <0.01) and 7% among females (p = 0.11). For the surveillance period, TBI-related death rates of males were higher than that of females among all age groups. Race TBI-related death rates were highest among American Indian/Alaska Natives at 27.2 deaths/100,000 population (41.5 and 13.8/100,000 among males and females, respectively) (Table 1) (Figure 2). Death rates among this population tended to decrease (13%) during the surveillance period, although this decrease was not statistically significant. Among blacks, the average TBI-related death rate during the surveillance period was 25.0 deaths/100,000 population (42.2 and 10.5/100,000 among males and females, respectively). Among racial populations evaluated, the greatest decrease in TBI-related mortality was observed among blacks (20%), with the majority of the decrease (19%) occurring in the interval 1994--1998. Among whites, the average TBI-related death rate during the surveillance period was 20.1 deaths/100,000 population (32 and 9.7/100,000 population among males and females, respectively). During 1989--1998, a 10% decrease in rates (p = <0.01) was observed for whites. Other races and persons with unknown race information (representing 2% of TBI fatalities) were grouped together (Table 1) with an overall death rate of 11.9 deaths/100,000 population (17.2 and 7.2/100,000 population among males and females, respectively). Death rates also decreased 17% among this group during the surveillance period. Major External Causes of TBI-Related DeathsFor the surveillance period, firearm-related, motor-vehicle--related, and fall-related TBIs were the three leading underlying causes of TBI-related death, accounting for 40%, 34%, and 10%, respectively, of all TBI-related deaths (Figure 3). Other causes, including cases with missing external cause-of-injury codes, accounted for 16%. The leading causes of TBI-related death differed among specific age groups: fatal motor-vehicle injuries were the leading cause of TBI-related deaths among children and youths aged 0--19 years (62%); fatal firearm-related injuries were the leading cause among adults aged 20--74 years (52%); and fatal fall-related injuries were the leading cause among adults aged >75 years (46%) (Figure 4) (Table 3). Trends by Cause During 1989--1998, the rates for fall-related TBI deaths increased by 25% (Table 4); whereas the rates for firearm-related TBIs declined by 14% (p = 0.02) (Table 5); and the rates for motor-vehicle--related TBIs declined by 22% (Table 6). Shifts occurred in observed trends between the first half and second half of the surveillance period. Firearm-related TBI rates began to decline after 1994. In contrast, motor-vehicle--related TBI rates declined 19% during 1989--1994, but since then have declined only slightly (Figure 5). The rates of fall-related TBIs began to increase in 1995. Firearm-Related TBI Deaths by Age, Sex, Intentionality, and Race The highest firearm-related TBI death rates were among persons aged 20--24 years (Table 3). The majority of firearm-related TBI deaths involved males (85%), among whom the death rate was substantially greater than among females (14.5 versus 2.4/100,000 population, respectively). Among all firearm-related TBI deaths; 68% were suicides; 27% were homicides (Table 5); and 5% were either unintentional, of unknown intentionality, or related to legal intervention. During 1989--1998, death rates for TBI involving firearms decreased 20% for homicides and 9% for suicides (p = <0.01). Firearm-related TBI death rates varied substantially by race (Tables 5 and 7). Firearm-related injury was the leading cause of TBI-related deaths among blacks, and 70% of these were homicides; rates were highest among males aged 20--24 years (60.7/100,000 population) (Table 7). During 1989--1998, firearm-related TBI death rates among blacks declined by 23%, although not statistically significant. Among whites, firearm-related injury was also the leading underlying cause of TBI-related deaths; 78% were suicides. Firearm-related TBI death rates were highest among white males aged 20--24 years (20.6/100,000) and white males aged >75 years (33.0/100,000). Firearm-related TBI rates among whites declined 12% (p = 0.01). Among American Indian/Alaska Natives, firearm-related injury was the second leading cause of TBI-related deaths; 63% of these were suicides. Rates were also highest among males aged 20--24 years (26.2/100,000). During 1989--1998, rates of firearm-related TBI deaths increased slightly (1%) among American Indians/Alaska Natives. Motor-Vehicle--Related TBI Deaths by Age, Sex, and Race The highest motor-vehicle--related TBI death rates were among persons aged 15--19 (15.3/100,000) and 20--24 (14.6/100,000) years (Table 3). The overall incidence among males was >2 times that among females (9.9 and 4.3/100,000 population, respectively). Rates of motor-vehicle--related TBI deaths varied by race (Tables 6 and 8). The annual average rate among whites was 7.2/100,000, and the annual rate declined 21% during 1989--1998 (p = <0.01). Among blacks, the average annual rate of these injuries was 6.3/100,000, with a 14% decline during the same period (p = 0.02). The average annual motor-vehicle--related TBI death rate among American Indians/Alaska Natives was higher at 12.5/100,000, with an 18% decline during 1989--1998. This rate decline was not statistically significant (p = 0.33). For each of these races, rates of motor-vehicle--related TBI death were highest among males aged 20--24 years: 23.4/100,000 for white males, 17.1/100,000 for black males, and 35.0/100,000 for American Indian/Alaskan Native males. Fall-Related TBI Deaths by Age, Sex, and Race Among persons aged >75 years, falls were the leading cause of fatal TBIs for blacks, American Indians/Alaska Natives, and whites (Table 9). Compared with annual fall-related TBI death rates for persons aged <65 years, the rate ratio of fatal fall-related TBIs was 5.6 for persons aged 65--74 years, and 21.4 for persons aged >75 years. Death rates among persons with these injuries were considerably higher among males than females (3.2 and 1.3/100,000 population, respectively). During the surveillance period, the average rate among whites was 2.1/100,000, with an increase of 32%. Among blacks, the average annual rate of these injuries was 1.9/100,000, with an 18% decline during the same period (p = 0.01) (Table 4). Among American Indians/Alaska Natives, the corresponding average annual rate was 2.3/100,000 population. The limited annual number of fall-related TBI deaths among this group precluded a reliable assessment of the change in race-specific rates during 1989--1998. DiscussionThe data presented in this report document an overall decline in rates of TBI-related deaths in the United States during 1989--1998. During 1980--1995, an even steeper decline was observed in rates of hospital admission as a result of TBI (32). Multiple factors might have contributed to the declines in TBI-related mortality. For example, these decreasing rates might result in part from improvements in the medical care of severely brain-inured patients, perhaps influenced by evidence-based guidelines, which were developed and disseminated during the surveillance period (33,34), for emergency and acute management of TBIs. However, the decline in rates of TBI-related deaths closely parallels the 9.1% decline in age-adjusted rates of injury death of all types that occurred during the same period (35), indicating that the decrease in TBI-related death rates might be attributed in part to success in general injury-prevention efforts. Effective interventions have resulted in increases in use of seatbelts and child safety seats. Examples of strategies that have demonstrated success include primary enforcement of restraint laws, graduated licensing of new drivers, and community-based health education campaigns (36,37). During 1989--1998, a shift occurred in the distribution and trends of external causes of TBI. Most importantly, fall-related TBI death rates have steadily increased since 1995. This increase warrants a closer examination of the circumstances leading to these fatal fall injuries (1,19,27). To determine if changes during the surveillance period in the age distribution of persons aged >75 years might have accounted for this increasing TBI-related death rate, the >75 age group was further categorized into those aged 75--79 years, 80--84 years, and >85 years. The findings remained consistent for the subgroups of persons aged >75 years. Although the data indicated that age-specific rates have increased most among the oldest age groups, the reasons are unknown. Part of the increase might be caused by more complete TBI diagnosis among older adults as a result of greater use of brain-imaging procedures (38). Also, changes might have occurred in reporting fall-related events on death certificates (i.e., physicians might now be coding more fall-related events). A possibility also exists of changes in the prevalence of intrinsic (e.g., muscle strength, gait, and cognitive impairment) and extrinsic (e.g., stairs, lack of safety features in bathrooms, worn out carpets that can cause a person to trip, and slippery surfaces) risk factors for falls among the older population (39--43), which might have contributed to the increase in fall-related TBI deaths. Additionally, such risk factors as health behaviors, medication use, comorbid conditions, and those for hemorrhagic complications of TBI (e.g., anticoagulant or platelet-inhibiting medications) (44--47) might also have an effect. Appropriate prevention efforts will require better understanding of the specific circumstances leading to falls among older persons. For the total population, firearm-related TBI death rates, which had been increasing until 1994, are now declining. These declines are consistent with declines in the rates of fatal and nonfatal firearms injuries across all population subgroups in the United States (48--51). The circumstances of those firearm-related TBI deaths differ by population: white males are at highest risk for suicide-related TBI (i.e., firearm-related suicides), whereas young black males are at highest risk for homicide. Violence-prevention efforts need to identify these groups most at risk and focus on modifying risk behaviors. Motor-vehicle--related TBI death rates have demonstrated only a limited change since 1994. This trend parallels the limited decrease in death rates related to all motor-vehicle--related deaths, which have also exhibited limited decrease since 1994 (49). Data from the National Highway Traffic Safety Administration indicate that since 1994, further decreases have occurred in the proportions of fatal crashes without occupant restraint use and further decreases in the proportions involving alcohol use (52). However, during this period, the distribution of fatal injuries by vehicle types has shifted. During 1994--1998, the number of persons killed in passenger cars decreased 4%, and those injured decreased 7%. Conversely, the number of persons killed and those injured in light trucks* increased by 20% and 21%, respectively. More light trucks are in use, whereas the number of passenger cars is decreasing. Because the rates of fatal crashes are higher in light trucks than in passenger cars (light trucks have fewer required safety features compared with cars) (52), safety features of these vehicles should be enhanced through such mechanisms as technological advances, engineering solutions, or behavioral change strategies (53). Despite the decline in fatal TBI incidence during the surveillance period, the actual number of deaths has not decreased. In addition, population groups with the highest TBI-related death rates have also not changed (1,4,19). TBI-related mortality remains a key public health challenge. Public health and transportation safety professionals can address these challenges by developing comprehensive injury-prevention programs and by implementing multiple interventions based on a thorough assessment of the factors that influence health-related behaviors. Injury-prevention programs should take a multidisciplinary approach to solving injury problems and should enlist the public as full partners in finding and implementing solutions (53). LimitationsCertain limitations are associated with using the NCHS Multiple Cause of Death data to describe fatal TBI trends. Race/ethnicity data might be misclassified because this information is provided by funeral directors on the basis of next-of-kin or other informant communication or through observation (54--56). Data are less reliable for certain groups than others. In particular, data for American Indian/Alaska Native populations are underestimated by <21%, whereas rates for white and black populations are estimated to be overstated by 1%--5% (55). Because TBI-related deaths were identified where any of the TBI diagnostic codes appeared in a series of events leading to death, the accuracy and reliability of codes are dependent on accurate diagnoses and on the care with which these diagnoses are recorded on death certificates by physicians, medical examiners, or coroners (54). The quality of medical certification on death certificates has not been evaluated fully (54). Additionally, because TBI-related deaths were selected where >1 TBI diagnostic code was included in the sequence of conditions leading to death, not all of the deaths that are associated with TBI constitute deaths that are actually a result of TBI. Lack of a narrative text in the NCHS Multiple Cause of Death data is also a limitation because critical circumstances contributing to injury might not be recorded. The original death certificate does include a narrative describing the injury. Nosologists review these narratives to ensure that the causes of death are correctly classified. However, the narrative is not retained on the public use data set. Lastly, the NCHS Multiple Cause of Death data do not reflect other adverse health effects of TBI (e.g., disability and nonfatal TBI). Although fatal TBI reflects injuries of the greatest severity, annually, >1 million visits are made to hospital emergency departments for TBI-related injuries (57); >230,000 TBI-related hospitalizations occur (4); and an estimated 5.3 million U.S. residents live with permanent TBI-related disabilities (27). ConclusionThe findings presented in this report document continued deaths from TBIs among the U.S. population, a burden that varies substantially among sex, age, and racial groups. These data also demonstrate an increase in deaths from fall-related TBIs. Although strategies for preventing and managing falls among older adults have been developed (58,59), further research is essential to guide development of more effective prevention strategies. As a first step toward achieving greater reductions in TBI mortality and morbidity, dissemination of these findings is critical to public health and injury-control professionals, policy makers, those at high risk, and the general public. Acknowledgments The authors acknowledge the contributions of the following CDC staff: Suzanne Binder, M.D., Richard Sattin, M.D., Daniel Pollock, M.D, Bruce Jones, M.D., Donna Hoyert, Ph.D., Joseph Lee Annest, Ph.D., Ann Dellinger, Ph.D., Judy Stevens, Ph.D., James Belloni, Jane McDonald, M.Ed., Tom Bartenfeld, Ph.D., and Jean Langlois, Sc.D. References
* Light trucks include pickups, vans, and utility vehicles with a gross vehicle weight rating of <10,000 pounds. Table 1 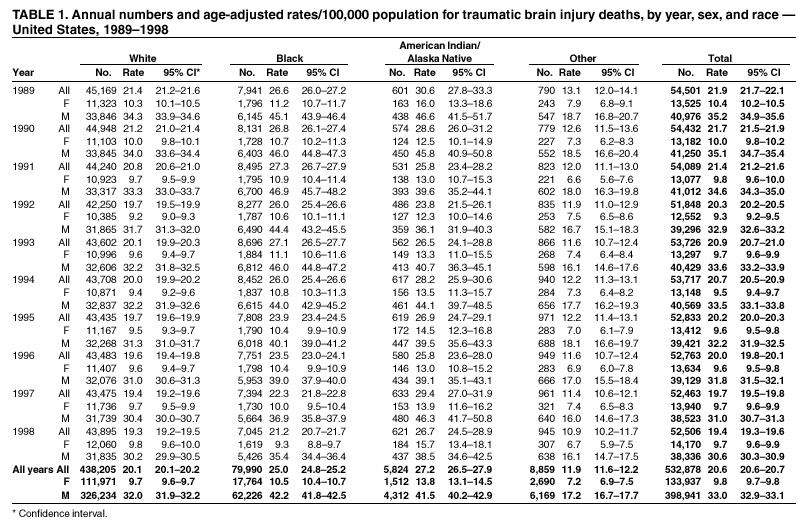 Return to top. Figure 1 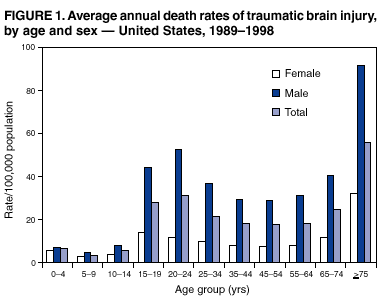 Return to top. Table 2 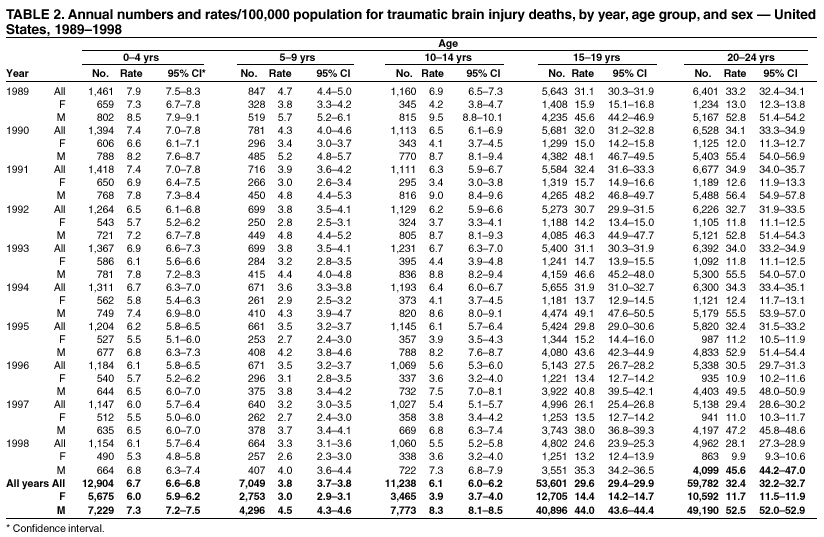 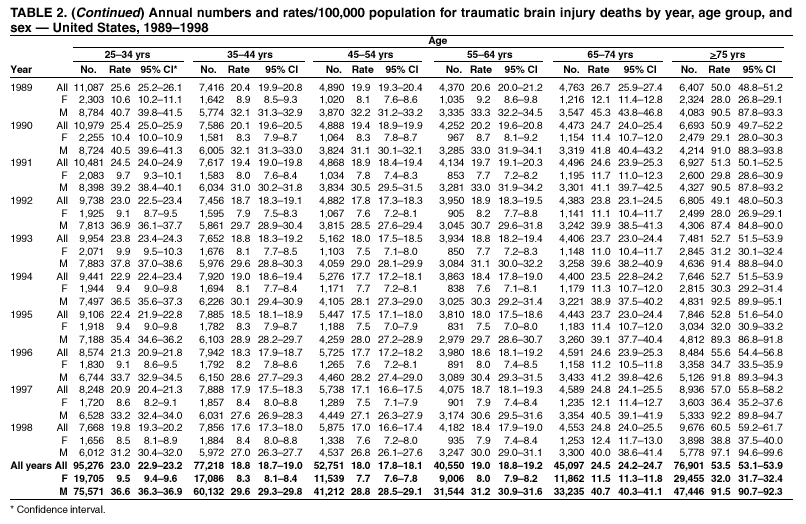 Return to top. Figure 2 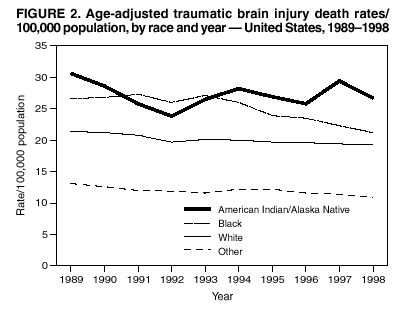 Return to top. Table 3 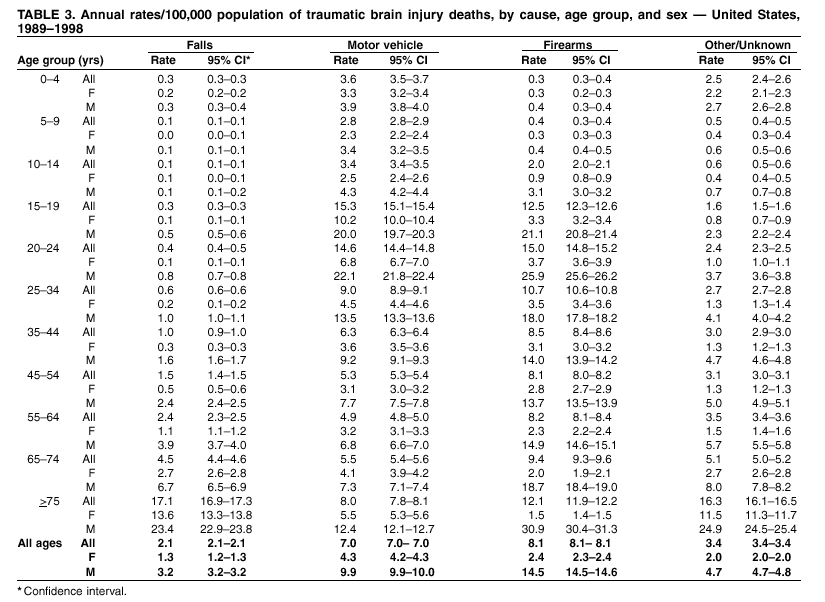 Return to top. Figure 3 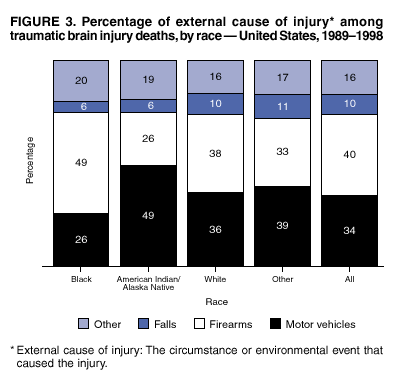 Return to top. Table 4  Return to top. Figure 4 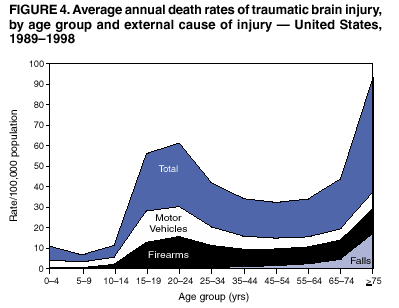 Return to top. Table 5 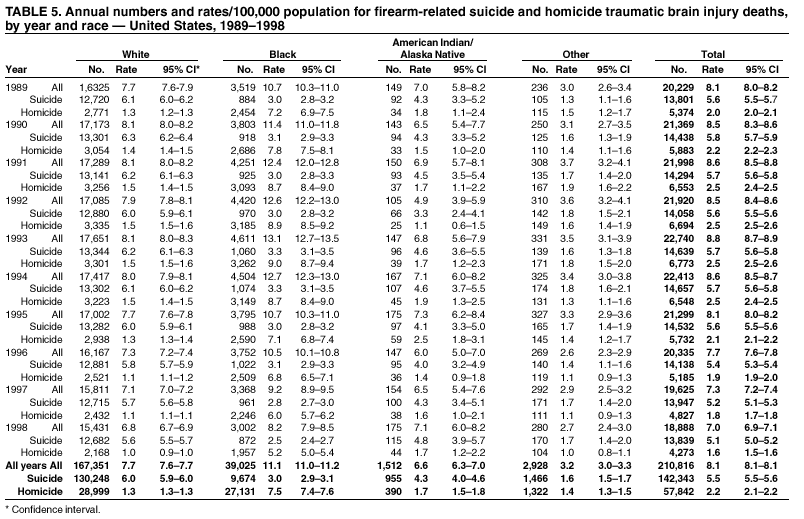 Return to top. Figure 5 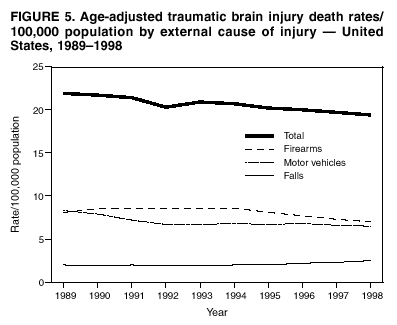 Return to top. Table 6  Return to top. Table 7 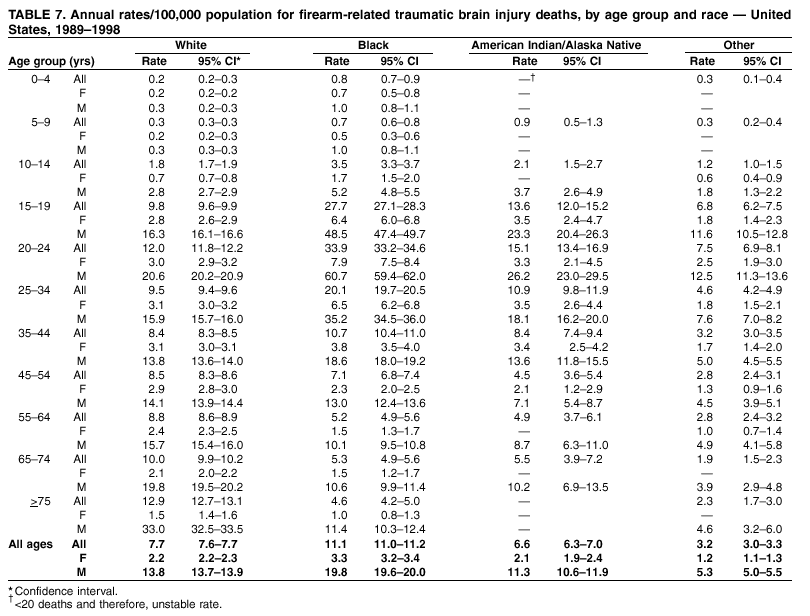 Return to top. Table 8 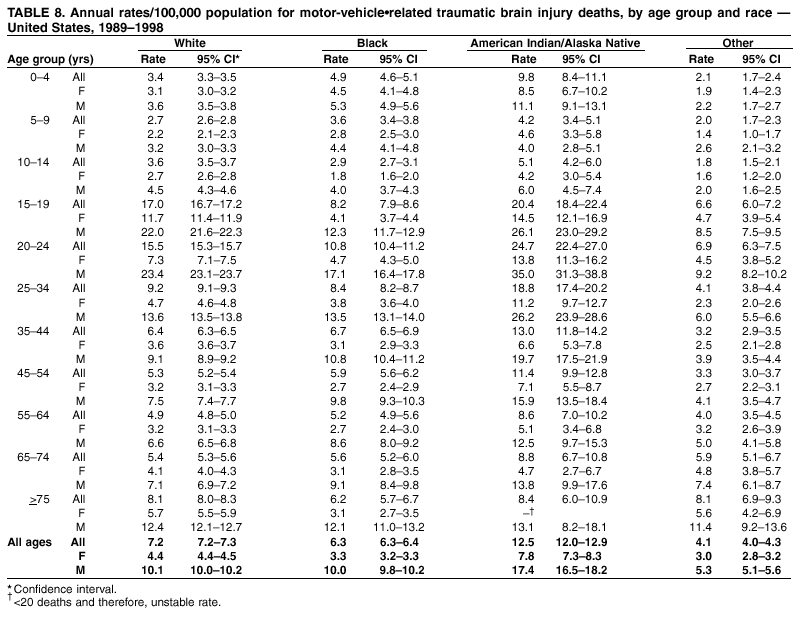 Return to top. Table 9 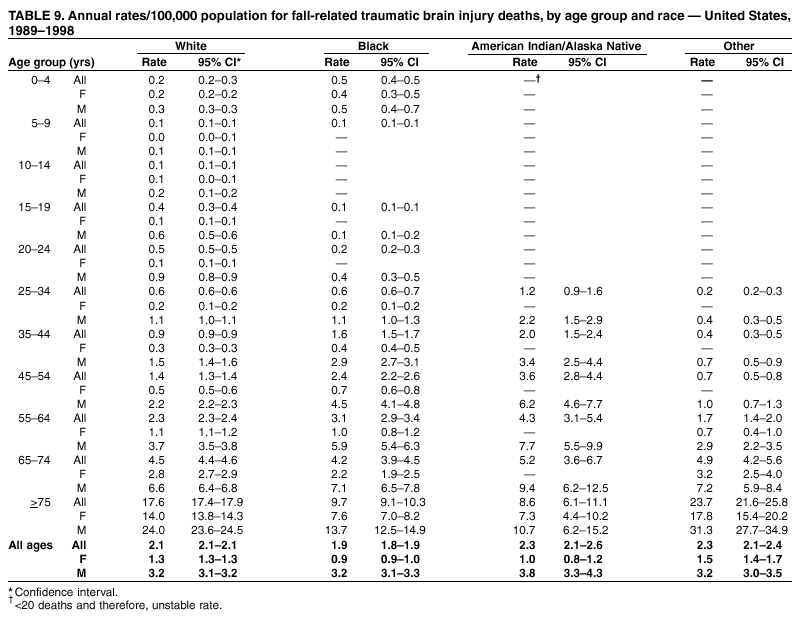 Return to top.
Disclaimer All MMWR HTML versions of articles are electronic conversions from ASCII text into HTML. This conversion may have resulted in character translation or format errors in the HTML version. Users should not rely on this HTML document, but are referred to the electronic PDF version and/or the original MMWR paper copy for the official text, figures, and tables. An original paper copy of this issue can be obtained from the Superintendent of Documents, U.S. Government Printing Office (GPO), Washington, DC 20402-9371; telephone: (202) 512-1800. Contact GPO for current prices. **Questions or messages regarding errors in formatting should be addressed to [email protected].Page converted: 11/19/2002 |
|||||||||
This page last reviewed 11/19/2002
|