Persons using assistive technology might not be able to fully access information in this file. For assistance, please send e-mail to: [email protected]. Type 508 Accommodation and the title of the report in the subject line of e-mail.
Influenza Vaccination Coverage --- United States, 2000--2010
Rosanna W. Setse, MD, PhD
Gary L. Euler, DrPH
Amparo G. Gonzalez-Feliciano, MPH
Leah N. Bryan, MS, MPH
Carolyn Furlow, PhD
Cindy M. Weinbaum, MD
James A. Singleton, MS
National Center for Immunization and Respiratory Diseases, CDC
Corresponding author: Gary L. Euler, DrPH, Immunization Services Division, National Center for Immunization and Respiratory Diseases CDC, 1600 Clifton Road, N.E., Mail Stop E-62, Atlanta, GA 30333. Telephone: 404-639-8742; Fax: 404-639-3266; E-mail: [email protected].
Vaccines are among the greatest public health achievements of the 20th century (1). The majority of Healthy People 2010 (HP2010) objectives for early childhood vaccination coverage were met by the end of 2010 (2), and progress has been made toward eliminating disparities in vaccination coverage among children (3,4). Remarkable progress also has been made in improving coverage and reducing disparities in coverage for adolescent vaccinations recommended since 2005 (5). Although childhood vaccination programs in the United States have been successful, adolescent programs remain relatively new and adult vaccination programs, although well established, have not achieved acceptable levels of success. Among adults, substantial disparities in vaccination coverage have persisted (6--10). A particular challenge for prevention of influenza is the need for annual vaccination. During 1989--1999, national influenza vaccination coverage among persons aged ≥65 years increased each year for all racial/ethnic groups; however, the rate of increase slowed during 1997--2001, and vaccination coverage among non-Hispanic blacks and Hispanics remained lower compared with non-Hispanic whites throughout the entire period (1989--2001) (11).
To examine racial/ethnic disparities in influenza vaccination coverage among all persons aged ≥6 months for the 2009--10 influenza season as well as trends in racial/ethnic disparities in influenza vaccination coverage for the 2000--01 through 2009--10 influenza seasons among adults aged ≥65 years, CDC analyzed data from the 2002--2010 Behavioral Risk Factor Surveillance System (BRFSS) questionnaire and the National 2009 H1N1 Flu Survey (NHFS). Racial/ethnic disparities were focused on because these disparities in vaccination coverage have been documented (11--13) more extensively compared with other disparity domains (e.g., sex, income, education, and disability status). State-level estimates have been published previously (14,15) and are not included in this report. Additional information is available at http://www.cdc.gov/flu/professionals/vaccination/vaccinecoverage.htm.
BRFSS is a state-based telephone survey collecting information from approximately 400,000 randomly selected persons aged ≥18 years among the noninstitutionalized, U.S. civilian population. NHFS was a national random-digit--dialed telephone survey conducted in all 50 states and the District of Columbia (DC) during October 2009--June 2010 to track both influenza A (H1N1) 2009 monovalent vaccination (H1N1 influenza vaccination) and seasonal influenza vaccination coverage (14,15). In the 2009--10 influenza season, BRFSS respondents were asked if they (or their children, in 43 states and DC) had been vaccinated for the "seasonal flu" in the past 12 months or if they (in 49 states and DC, or their children in 46 states and DC) had been vaccinated for "H1N1 flu" since September 2009, and if so, in which month. NHFS respondents aged ≥18 years were asked whether they (or their children) had received "seasonal flu vaccination" since August 2009 or "H1N1 flu" vaccination since September 2009 and if so, in which month. The Council of American Survey and Research Organizations (CASRO) response rates* for NHFS were 34.0% for landline and 25.5% for cellular telephones; cooperation rates were 45% and 57%, respectively. The median state CASRO response and cooperation rates for BRFSS were 54% and 76%, respectively.
CDC used the Kaplan-Meier survival analysis method to estimate the cumulative proportion of persons with ≥1 dose of combined seasonal or H1N1 influenza vaccination and seasonal (only) influenza vaccination during August 2009--May 2010 from BRFSS and NHFS monthly data. To improve precision for groups within states, particularly for children, CDC combined the estimates from BRFSS and NHFS. For respondents with missing information on month and year of vaccination, this information was imputed based on donor pools matched for week of interview, age group, state of residence and race/ethnicity. Racial/ethnic differences in combined seasonal or H1N1 influenza vaccination and seasonal (only) influenza vaccination coverage for the 2009--10 season were examined by using Student's t-tests for all persons aged ≥6 months, children aged 6 months--17 years, adults aged 18--49 years with high-risk† conditions, adults aged 50--64 years, and adults aged ≥65 years. All tests were two-tailed with an alpha level of 0.05. For adults aged ≥65 years, CDC examined trends in racial/ethnic disparities in influenza vaccination coverage over the previous decade by using 1) 2001--2009 BRFSS survey data collected during March--August each year (representing seasonal [only] influenza vaccinations received for the 2000--01 through 2008--09 influenza seasons) and 2) BRFSS and NHFS data collected during October 2009--June 2010 (representing influenza vaccinations received for the 2009--10 influenza season). Kaplan-Meier survival analysis was used to estimate coverage for the 2009--10 season. Point estimates and 95% confidence intervals (CIs) for each year were calculated for each racial/ethnic group (i.e., non-Hispanic whites, non-Hispanic blacks, Hispanics, and non-Hispanic other§ persons). In keeping with convention, non-Hispanic whites were chosen as the referent group because this is the largest racial/ethnic group in the United States, and this population has had historically higher coverage estimates. All analyses were conducted by using statistical software that account for the complex survey design, and results from both surveys were weighted to reflect the U.S. resident, civilian, noninstitutionalized population.
The estimated national combined seasonal or H1N1 influenza vaccination coverage levels for the 2009--10 influenza season among all persons aged ≥6months, children aged 6 months--17 years, adults aged 18--49 years with high-risk conditions, adults aged 50--64 years, and adults aged ≥65 years were 48.8%, 55.2%, 45.3%, 48.7%, and 72.0% respectively. Among all persons aged ≥6 months, combined seasonal or H1N1 influenza vaccination coverage was higher among non-Hispanic whites (49.5%) compared with non-Hispanic blacks (40.5%) and Hispanics (43.5%) (p<0.05 for both) (Table). For children aged 6 months--17 years, combined coverage was lower among blacks (49.4%) compared with whites (53.8%), and higher among Hispanics (61.2%) and other non-Hispanic persons (63.5%) compared with whites (p<0.05 for both). Among adults aged 18--49 years with high-risk conditions, no statistically significant differences by race/ethnicity were observed for combined seasonal or H1N1 influenza vaccination. For adults aged 50--64 years, non-Hispanic blacks (44.5%) and Hispanics (46.2%) had significantly lower combined seasonal or H1N1 influenza vaccination coverage, compared with non-Hispanic whites (49.8%). Similarly, for adults aged ≥65 years, non-Hispanic blacks (58.3%) and Hispanics (61.4%) had significantly lower combined seasonal or H1N1 influenza vaccination coverage compared with non-Hispanic whites (73.9) (p<0.05 for each). Racial/ethnic differences in seasonal (only) influenza vaccination coverage were similar to combined seasonal or H1N1 influenza vaccination coverage estimates except among adults aged 18--49 years with high-risk conditions, for whom seasonal (only) influenza vaccination coverage was higher among non-Hispanic whites (39.9%) than among non-Hispanic blacks (34.8%) (Table).
Among adults aged ≥65 years, racial/ethnic differences in influenza vaccination coverage persisted from 2000 through 2010, with non-Hispanic blacks consistently having the lowest coverage each year (Figure). The yearly gap in influenza vaccination coverage between non-Hispanic blacks and non-Hispanic whites from the 2000--01 to the 2009--10 season ranged from a difference of 15 to a difference of 23 percentage points. The gap between Hispanics and non-Hispanic whites ranged from 7 to 16 percentage points. The gap between non-Hispanic whites and other non-Hispanic persons ranged from <1 to 11 percentage points.
These findings are subject to at least three limitations. First, both BRFSS and NHFS are telephone-based surveys and do not include households without telephone service; in addition, BRFSS estimates did not include households with only cellular telephone service; such households are more likely to have younger occupants, minorities, and renters (16) whose vaccination levels might be lower than those among persons living in other households. For these reasons, the findings presented in this report might not be generalizable to the entire U.S. population. Second, response rates for both surveys were low, and nonresponse bias can remain even after weighting adjustments to reflect the national population subgroup distribution and nonresponse. Finally, self-reported vaccination status was not validated from medical records and is subject to recall bias.
For the 2009--10 influenza season, lower influenza vaccination coverage was observed for non-Hispanic blacks compared with non-Hispanic whites, among children aged 6 months--17 years, adults aged 50--64 years, and adults aged ≥65 years. Compared with the successes achieved in childhood vaccinations, among adults aged ≥65 years, substantial racial/ethnic disparities in influenza vaccination have persisted, and coverage remains well below the HP2010 target of 90%. This target hs been retained for HP2020 (17). Reasons for disparities in vaccination coverage are multifactorial (11,18--23). The Advisory Committee on Immunization Practices now recommends influenza vaccination for all persons in the United States aged ≥6 months (24) making monitoring of disparities in influenza vaccinations among all age groups essential. With implementation of the Vaccines for Children program, disparities among childhood vaccinations have been reduced substantially (25). To eliminate disparities in adult influenza vaccination, evidence-based interventions are needed, including the use of reminder/recall systems, standing orders for vaccination, regular assessments of vaccination coverage levels among provider practices, vaccination registries, improving public and provider awareness of the importance of vaccinations for adults, and public financing of recommended vaccines (26,27).
References
- CDC. Ten great public health achievements---United States, 1900--1999 MMWR 1999;48: 241.
- US Department of Health and Human Services. Healthy people 2010: midcourse review. 2nd ed. Washington, DC: US Department of Health and Human Services; 2006. Available at http://www.healthypeople.gov.
- Zhao Z, Luman ET. Progress toward eliminating disparities in vaccination coverage among U.S. children, 2000--2008. Am J Prev Med 2010;38:127--37.
- CDC. National, state, and local area vaccination coverage among children aged 19--35 months---United States, 2008. MMWR 2009;58:921--6.
- CDC. National, state, and local area vaccination coverage among adolescents aged 13--17 years---United States, 2009. MMWR 2010;59:1018--23.
- CDC. Public health and aging: influenza vaccination coverage among adults aged ≥50 years and pneumococcal vaccination coverage among adults aged ≥65 years---United States, 2002. MMWR 2003;52:987--92.
- CDC. State-specific influenza vaccination coverage among adults aged ≥18 years---United States, 2003--04 and 2005--06 influenza seasons. MMWR 2007;56:953--9.
- CDC. Influenza and pneumococcal vaccination levels among persons aged ≥65 years---United States, 2001. MMWR 2002;51:1019--24.
- Lu PJ, Bridges CB, Euler GL, et al. Influenza vaccination of recommended adult populations, U.S., 1989--2005. Vaccine 2008;26:1786--93.
- Lu PJ, Singleton JA, Rangel MC, et al. Influenza vaccination trends among adults 65 years or older in the United States, 1989--2002. Arch Intern Med 2005;165:1849--56.
- CDC. Racial/ethnic disparities in influenza and pneumococcal vaccination levels among persons aged ≥65 years---United States, 1989--2001. MMWR 2003;52: 958--62.
- Fiscella K, Dressler R, Meldrum S, et al. Impact of influenza vaccination disparities on elderly mortality in the United States. Prev Med 2007;45:83--7.
- Link MW, Ahluwalia IB, Euler GL, et al. Racial and ethnic disparities in influenza vaccination coverage among adults during the 2004--2005 season. Am J Epidemiol 2006;163:571.
- CDC. Interim results: state-specific seasonal influenza vaccination coverage---United States, August 2009--January 2010. MMWR 2010;59:477--84.
- CDC. Interim results: state-specific influenza A (H1N1) 2009 monovalent vaccination coverage---United States, October 2009--January 2010. MMWR 2010;59:363--8.
- Lavrakas PJ, Blumberg S, Battaglia M, et al. New considerations for survey researchers when planning and conducting RDD telephone surveys in the U.S. with respondents reached via cell phone numbers. Deerfield, IL: American Association for Public Opinion Research; 2010. Available at http://aapor.org/Cell_Phone_Task_Force.htm.
- US Department of Health and Human Services. Healthy people 2020---topics and objectives: immunization and infectious diseases. Available at http://www.healthypeople.gov/2020/topicsobjectives2020.
- CDC. Vaccination coverage by race/ethnicity and poverty level among children aged 19--35 months---United States, 1996. MMWR 1997;46:963--9.
- Adler NE, Boyce WT, Chesney MA. et al. Socioeconomic inequalities in health: no easy solution. JAMA 1993;269:3140--5.
- Gornick ME. A decade of research on disparities in Medicare utilization: lessons for the health and health care of vulnerable men. Am J Public Health 2003;93:753--9.
- Wooten KG, Luman ET, Barker LE. Socioeconomic factors and persistent racial disparities in childhood vaccination. Am J Health Behav 2007;31:434--45.
- Hebert PL, Frick KD, Kane RL, et al. The causes of racial and ethnic differences in influenza vaccination rates among elderly Medicare beneficiaries. Health Serv Res 2005;40: 517--37.
- Singleton JA, Santibanez TA, Wortley PM. Influenza and pneumococcal vaccination of adults aged ≥65: racial/ethnic differences. AmJ Prev Med 2005;29:412--20.
- CDC. Prevention and control of influenza with vaccines: recommendations of the Advisory Committee on Immunization Practices (ACIP), 2010. MMWR 2010;59(No. RR-8).
- CDC. National, state, and local area vaccination coverage among children aged 19--35 months---United States, 2009. MMWR 2010.59:1171--7.
- Pickering LK, Baker CJ, Freed GL, et al. Immunization programs for infants, children, adolescents, and adults: clinical practice guidelines by the Infectious Diseases Society of America. Clin Infect Dis 2009;49:817--40.
- Task Force on Community Preventive Services. Guide to community preventive services. Vaccinations to prevent diseases: universally recommended vaccinations. Available at http://www.thecommunityguide.org/vaccines/universally/index.htm.
|
Children aged 6 mos--17 yrs (n = 159,652)
|
Adults at high-risk§ aged 18--49 yrs (n = 21,821)
|
Adults aged 50--64 yrs (n = 117,267)
|
Adults aged ≥65 yrs (n = 112,752)
|
All aged ≥6 mos (n = 514,785)
|
%
|
(95% CI)
|
%
|
(95% CI)
|
%
|
(95% CI)
|
%
|
(95% CI)
|
%
|
(95% CI)
|
Combined seasonal or influenza A (H1N1) 2009 monovalent vaccination coverage
|
All
|
55.2
|
(54.4--56.0)
|
45.3
|
(43.7--46.9)
|
48.7
|
(48.1--49.3)
|
72.0
|
(71.6--72.5)
|
47.8
|
(47.4--48.2)
|
White, non-Hispanic
|
53.8
|
(52.9--54.7)
|
46.0
|
(44.3--47.7)
|
49.8
|
(49.2--50.4)
|
73.9
|
(73.4--74.4)
|
49.5
|
(49.1--49.9)
|
Black, non-Hispanic
|
49.4¶
|
(46.9--51.9)
|
42.0
|
(38.4--45.6)
|
44.5¶
|
(42.4--46.6)
|
58.3¶
|
(56.0--60.6)
|
40. 5¶
|
(39.3--41.7)
|
Hispanic
|
61.2¶
|
(59.1--63.3)
|
43.6
|
(39.5--47.7)
|
46.2¶
|
(43.4--49.0)
|
61.4¶
|
(58.1--64.7
|
43. 5¶
|
(42.2--44.8)
|
Other, non-Hispanic**
|
63.5¶
|
(60.6--66.4)
|
45.0
|
(39.0--51.0)
|
47.8
|
(44.7--50.9)
|
71.8
|
(68.7--74.9)
|
49.9
|
(48.3--51.5)
|
Seasonal (only) influenza vaccination coverage
|
All
|
43.7
|
(42.8--44.6)
|
38.2
|
(36.9--39.5)
|
45.0
|
(44.4--45.6)
|
69.6
|
(69.0--70.2)
|
41.2
|
(40.8--41.6)
|
White, non-Hispanic
|
43.2
|
(42.3--44.1)
|
39.9
|
(38.3--41.5)
|
46.5
|
(45.9--47.1)
|
71.7
|
(71.2--72.2)
|
43.9
|
(43.5--44.3)
|
Black, non-Hispanic
|
37.0¶
|
(34.4--39.6)
|
34.8¶
|
(31.5--38.1)
|
40.3¶
|
(38.3--42.3)
|
55.2¶
|
(52.9--57.5)
|
33.7¶
|
(32.5--34.9)
|
Hispanic
|
46.9¶
|
(44.3--49.5)
|
35.5
|
(31.6--39.4)
|
40.6¶
|
(37.9--43.3)
|
56.1¶
|
(52.8--59.4)
|
33.6¶
|
(32.4--34.8)
|
Other, non-Hispanic*
|
53.6¶
|
(50.5--56.7)
|
41.3
|
(35.5--47.1)
|
44.1
|
(40.6--47.6)
|
68.1
|
(64.9--71.3)
|
42.4
|
(40.8--44.0)
|
FIGURE. Influenza vaccination coverage for adults aged ≥65 years, by race/ethnicity ---Behavioral Risk Factor Surveillance System (BRFSS), United States, 2000--2010*
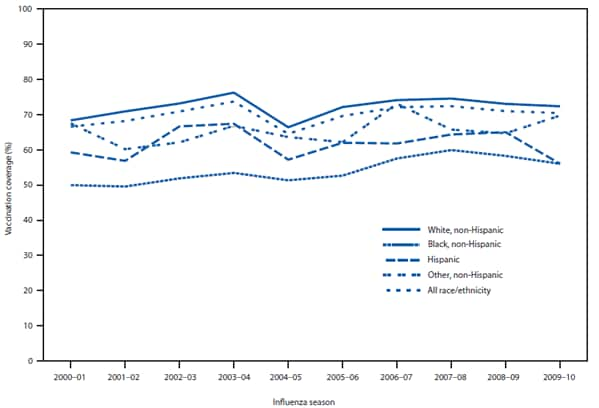
Alternate Text: This figure depicts the percentage of persons vaccinated against influenza viruses during 2000-2010, by race/ethnicity. For the 2000-01 through 2008-09 seasons, BRFSS survey data collected during March-August each year were used to estimate point estimates of coverage for adults aged ≥65 years. For the 2009-10 season time point, Kaplan-Meier survival analysis was used to estimate coverage among adults ≥65 years by using BRFSS and National H1N1 Flu Survey data collected during October 2009-June 2010. The 2009-10 time point estimates do not include influenza A (H1N1) 2009 monovalent vaccinations.
Use of trade names and commercial sources is for identification only and does not imply endorsement by the U.S. Department of
Health and Human Services.
References to non-CDC sites on the Internet are
provided as a service to MMWR readers and do not constitute or imply
endorsement of these organizations or their programs by CDC or the U.S.
Department of Health and Human Services. CDC is not responsible for the content
of pages found at these sites. URL addresses listed in MMWR were current as of
the date of publication.
All MMWR HTML versions of articles are electronic conversions from typeset documents.
This conversion might result in character translation or format errors in the HTML version.
Users are referred to the electronic PDF version (http://www.cdc.gov/mmwr)
and/or the original MMWR paper copy for printable versions of official text, figures, and tables.
An original paper copy of this issue can be obtained from the Superintendent of Documents, U.S.
Government Printing Office (GPO), Washington, DC 20402-9371;
telephone: (202) 512-1800. Contact GPO for current prices.
**Questions or messages regarding errors in formatting should be addressed to
[email protected].