 |
|
|
|
|
|
|
|
|
|
|
|
|
|
|
|
|
||||
| ||||||||||
|
|
|
|
|
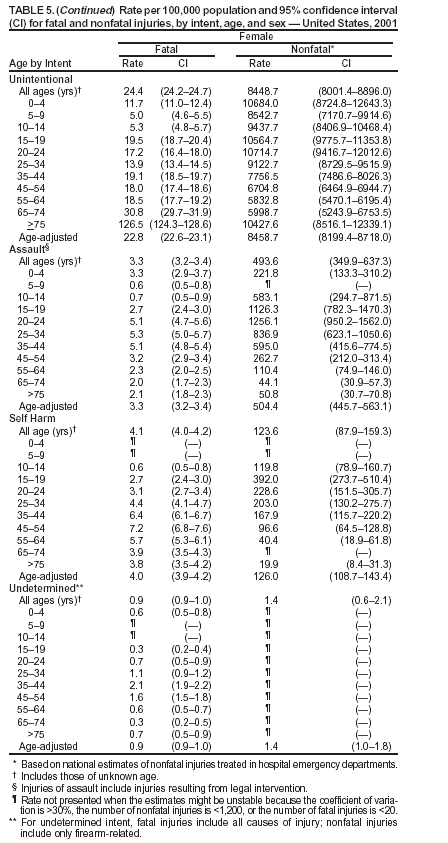
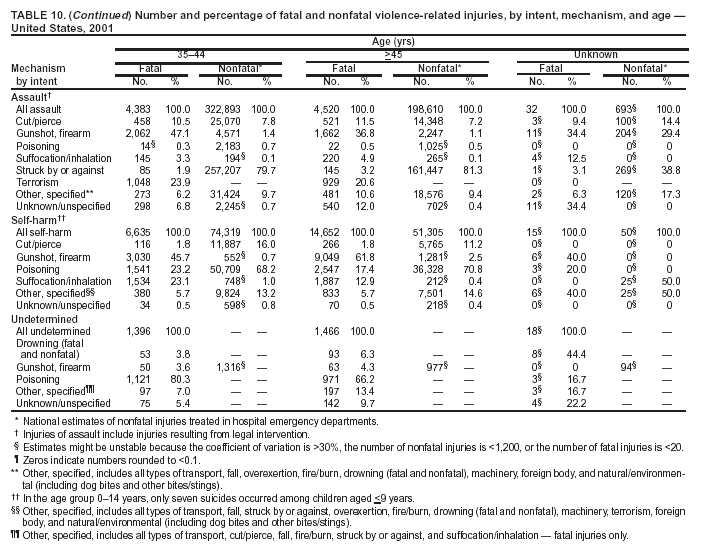
Persons using assistive technology might not be able to fully access information in this file. For assistance, please send e-mail to: [email protected]. Type 508 Accommodation and the title of the report in the subject line of e-mail. Surveillance for Fatal and Nonfatal Injuries --- United States, 2001Sara B. Vyrostek Corresponding author: J. Lee Annest, Ph.D., Director, Office of Statistics and Programming, CDC/NCIPC/OSP, 1600 Clifton Rd., NE, MS K-59, Atlanta, GA 30333; Telephone: 770-488-4804; Fax: 770-488-1665; E-mail: [email protected]. Abstract Problem/Condition: Each year in the United States, an estimated one in six residents requires medical treatment for an injury, and an estimated one in 10 residents visits a hospital emergency department (ED) for treatment of a nonfatal injury. This report summarizes national data on fatal and nonfatal injuries in the United States for 2001, by age; sex; mechanism, intent, and type of injury; and other selected characteristics. Reporting Period: January--December 2001. Description of the System: Fatal injury data are derived from CDC's National Vital Statistics System (NVSS) and include information obtained from official death certificates throughout the United States. Nonfatal injury data, other than gunshot injuries, are from the National Electronic Injury Surveillance System All Injury Program (NEISS-AIP), a national stratified probability sample of 66 U.S. hospital EDs. Nonfatal firearm and BB/pellet gunshot injury data are from CDC's Firearm Injury Surveillance Study, being conducted by using the National Electronic Injury Surveillance System (NEISS), a national stratified probability sample of 100 U.S. hospital EDs. Results: In 2001, approximately 157,078 persons in the United States (age-adjusted injury death rate: 54.9/100,000 population; 95% confidence interval [CI] = 54.6--55.2/100,000) died from an injury, and an estimated 29,721,821 persons with nonfatal injuries (age-adjusted nonfatal injury rate: 10404.3/100,000; 95% CI = 10074.9--10733.7/100,000) were treated in U.S. hospital EDs. The overall injury-related case-fatality rate (CFR) was 0.53%, but CFRs varied substantially by age (rates for older persons were higher than rates for younger persons); sex (rates were higher for males than females); intent (rates were higher for self-harm--related than for assault and unintentional injuries); and mechanism (rates were highest for drowning, suffocation/inhalation, and firearm--related injury). Overall, fatal and nonfatal injury rates were higher for males than females and disproportionately affected younger and older persons. For fatal injuries, 101,537 (64.6%) were unintentional, and 51,326 (32.7%) were violence-related, including homicides, legal intervention, and suicide. For nonfatal injuries, 27,551,362 (92.7%) were unintentional, and 2,155,912 (7.3%) were violence-related, including assaults, legal intervention, and self-harm. Overall, the leading cause of fatal injury was unintentional motor-vehicle--occupant injuries. The leading cause of nonfatal injury was unintentional falls; however, leading causes vary substantially by sex and age. For nonfatal injuries, the majority of injured persons were treated in hospital EDs for lacerations (25.8%), strains/sprains (20.2%), and contusions/abrasions (18.3%); the majority of injuries were to the head/neck region (29.5%) and the extremities (47.9%). Overall, 5.5% of those treated for nonfatal injuries in hospital EDs were hospitalized or transferred to another facility for specialized care. Interpretation: This report provides the first summary report of fatal and nonfatal injuries that combines death data from NVSS and nonfatal injury data from NEISS-AIP. These data indicate that mortality and morbidity associated with injuries affect all segments of the population, although the leading external causes of injuries vary substantially by age and sex of injured persons. Injury prevention efforts should include consideration of the substantial differences in fatal and nonfatal injury rates, CFRs, and the leading causes of unintentional and violence-related injuries, in regard to the sex and age of injured persons. IntroductionIn 2001, a total of 157,078 persons died from unintentional injury or violence. Although unintentional injury was the leading cause of death for persons aged 1--34 years, unintentional injury, homicide, and suicide were among the 10 leading causes of death for persons aged 1--44 years (1). In 2001, an estimated 29.7 million injured persons were treated in hospital emergency departments (EDs) in the United States. Although the majority of these persons were injured unintentionally, >2 million of them suffered violence-related injuries (1). Certain types of these injuries have short- and long-term health consequences and adversely affect the quality of life of those who survive severe and life-threatening injuries, especially those suffering from a traumatic brain injury (TBI) or spinal cord injury. Each year, approximately 1.5 million U.S. residents sustain a TBI, of which approximately 50,000 die, accounting for one third of all injury-related deaths (2,3). In 2000, the annual direct medicals cost of injuries was estimated to be $117 billion, posing a substantial burden on society (4). This report provides the first summary of national data for both fatal and nonfatal injuries. The fatal injury data are from the National Vital Statistics System (NVSS), operated by CDC's National Center for Health Statistics (NCHS). The nonfatal injury data are from the U.S. Consumer Product Safety Commission's (CPSC's) National Electronic Injury Surveillance System (NEISS) and NEISS All Injury Program (NEISS-AIP). The findings in this report identify groups at increased risk for sustaining an acute injury leading to an ED visit, hospitalization, or death. This report provides summary data for those persons engaged in injury prevention activities and injury research to gain insights regarding the magnitude of the injury problem and distribution of fatal and nonfatal injuries among the U.S. population. Nationally representative data on fatal and nonfatal injuries and injury rates are presented by selected characteristics, including age, sex, race/ethnicity, intent of injury, and mechanism of injury. For nonfatal injuries only, data are also summarized by disposition at ED discharge, principal diagnosis, primary body part affected, and locale where the injury incident occurred. Temporal trends in fatal and nonfatal injury rates across time are not presented in this report but will be reported when more years of NEISS-AIP nonfatal injury data become available. Although age-adjusted death rates from unintentional injury, homicide, and suicide have declined since the early 1990s (1), injury remains a major public health concern, with substantial disparities among populations in the United States. This report provides information on selected disparities regarding fatal and nonfatal injury rates and the lethality of injury by age, sex, cause of injury, and intent of injury. MethodsData SourcesFor this report, two independent data sources were used. First, fatal injury data were obtained from NVSS. Data represent all injury-related deaths on the basis of all death certificates filed in 2001 throughout the 50 states and the District of Columbia. Second, nonfatal injury data, other than gunshot injury data, were obtained from NEISS-AIP (5--8). Nonfatal firearm and BB/pellet gunshot data were obtained from the CDC Firearm Injury Surveillance Study being conducted by using NEISS (9). Nonfatal firearm injury data from this study were used because cases of undetermined intent are classified separately from those of unintentional injuries, assaults, self-harm, and legal intervention; this was not done in NEISS-AIP. In 2001, approximately 17% of firearm-related injury cases in NEISS were classified as undetermined intent. NEISS-AIP is also operated by CPSC in collaboration with CDC's National Center for Injury Prevention and Control (NCIPC). NEISS is composed of a national stratified, probability sample of 100 hospitals drawn from all U.S. hospitals with >6 beds and that provide 24-hour emergency service. NEISS-AIP represents a national subsample of 66 NEISS hospitals (7). NEISS hospitals were sampled with five strata, four of which were defined by hospital size (i.e., small, medium, large, very large) based on the annual number of ED visits, plus one stratum for children's hospitals (6). Case DefinitionsFatal injuries were defined as all deaths where injury was assigned as the underlying cause of death, including those with International Statistical Classification of Diseases and Related Health Problems, 10th Revision, (ICD-10), external cause-of-injury code V01--Y36, Y85--Y87, Y89, or *U01--*U03* (10,11). For nonfatal injuries treated in U.S. hospital EDs, an injury was defined as bodily harm resulting from acute exposure to an external force or substance (i.e., mechanical, thermal, electrical, chemical, or radiant) and drowning (fatal and nonfatal), including unintentional, violence-related, and undetermined causes. Cases were excluded if 1) the principal diagnosis was an illness, pain only, psychological harm (e.g., anxiety and depression) only, contact dermatitis associated with exposure to consumer products (e.g., body lotions, detergents, or diapers) and plants (e.g., poison ivy), or unknown; or 2) the ED visit was for adverse effects of therapeutic drugs or of surgical and medical care (12). VariablesIntent of Injury For fatal injuries, age, sex, race/ethnicity, and the underlying cause of death as recorded on the death certificate were used. Manner of death or intent of injury was reported as unintentional, homicide, legal intervention, suicide, and undetermined intent. For nonfatal injuries other than gunshot injuries, age, sex, race/ethnicity, disposition at discharge (i.e., treated and released, hospitalized/transferred to another health-care facility, observed/held for observation, or unknown), intent of injury (i.e., unintentional, assault, legal intervention, or intentional self-harm), mechanism of injury (e.g., cut/pierce, drowning [fatal and nonfatal], fall, or fire/burn), principal diagnosis (e.g., burn, contusion/abrasion, or fracture), primary body part affected, and locale where the injury incident occurred (e.g., home, street, or public building) were used. All of these variables were based on information abstracted from ED records. Regarding intent of injury for nonfatal injuries other than gunshot injuries, categories were defined as the following:
For nonfatal firearm and BB/pellet gunshot injuries, intent of injury was classified as unintentional, assault, self-harm, and undetermined intent. For these cases, intent was recorded as undetermined if information in the ED record did not clearly indicate whether the gunshot injury was unintentionally inflicted by oneself or another person, intentionally inflicted by another person (assault), or intentionally self-inflicted (self-harm). Because of the limited number of cases of legal intervention, injuries related to legal intervention were combined with assault-related injuries. For brevity, the combination of assault and legal intervention cases are referred to as assault throughout the report. However, to be consistent with the national standard in definitions of leading causes of death (13), assaults and homicides were tabulated separately from cases of legal intervention for ranking the leading causes of injury-related death. Mechanism of Injury The mechanism of fatal injury was classified by using ICD-10 external cause-of-injury codes into major external cause-of-injury groupings (11). Because of the orientation of the ICD-10 external cause-of-injury coding system, certain transportation-related deaths in NVSS were classified as unspecified transport rather than in the specific categories defined previously for the nonfatal injury cases from NEISS-AIP. Therefore, to create transportation-related categories by using death data from NVSS that were comparable with those for nonfatal injuries from NEISS-AIP, unspecified transportation-related deaths were redistributed into the five transportation-related categories (i.e., motor-vehicle [MV] traffic occupant, motorcyclist, pedal cyclist, pedestrian, and other, specified). Unspecified deaths were redistributed by age and sex on the basis of the distribution of traffic-related deaths by person type obtained from the Fatality and Analysis Reporting System (FARS) (12,14). In a given age and sex group, unspecified cases were distributed into the transportation-related categories of motorcyclist, pedal cyclist, pedestrian, and other, specified, until the NVSS counts were equal to those in FARS. If the NVSS count was initially greater than FARS, the NVSS count was not changed. The remainder of the unspecified deaths was specified as MV-traffic occupant. The adjusted transportation-related categories were then summed over all age and sex combinations to achieve final numbers comparable with those present in the nonfatal data (Table 1). The mechanism of nonfatal injury was classified as the precipitating cause or the mechanism that started the chain of events leading to the injury (15). For each case, the precipitating cause was classified by trained coders, using narrative descriptions of the incident, into one of 22 mechanisms (or causes) of injury groupings by using guidelines consistent with the International Classification of Diseases, 9th Revision, Clinical Modification (ICD-9-CM) external cause-of-injury codes or E codes (5,16). Cases were not assigned ICD-9-CM external cause-of-injury codes because of the substantial number of cases and limited resources. The 22 mechanism of nonfatal injury categories were defined as follows:
--- MV-traffic occupant. Injury to a driver or passenger of a motor vehicle caused by a collision, rollover, crash, or other event involving another vehicle, an object, or a pedestrian and occurring on a public highway, street, or road (i.e., originating on, terminating on, or involving a vehicle partially on the highway). This category includes occupants of cars, pickup trucks, vans, heavy transport vehicles, buses, and sport utility vehicles (SUVs). Injuries to occupants of other types of vehicles (e.g., all-terrain vehicles [ATVs], snowmobiles, and go-carts) fall in the other transport category.
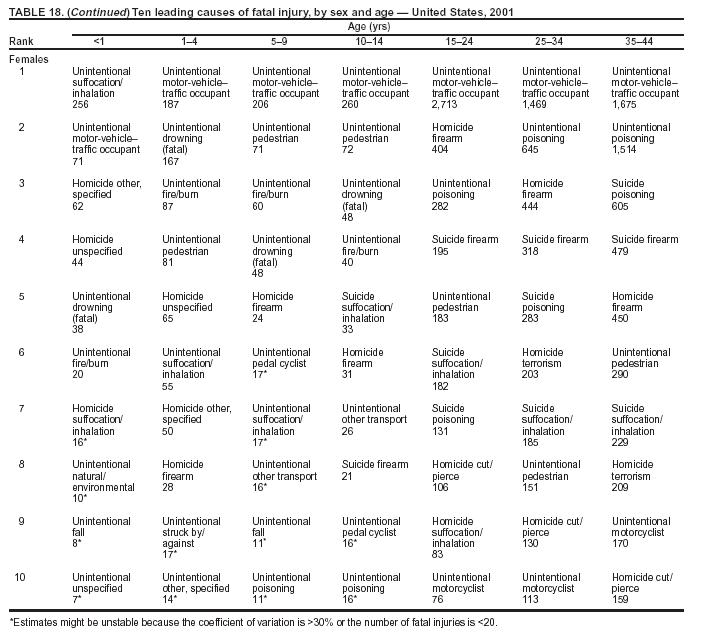
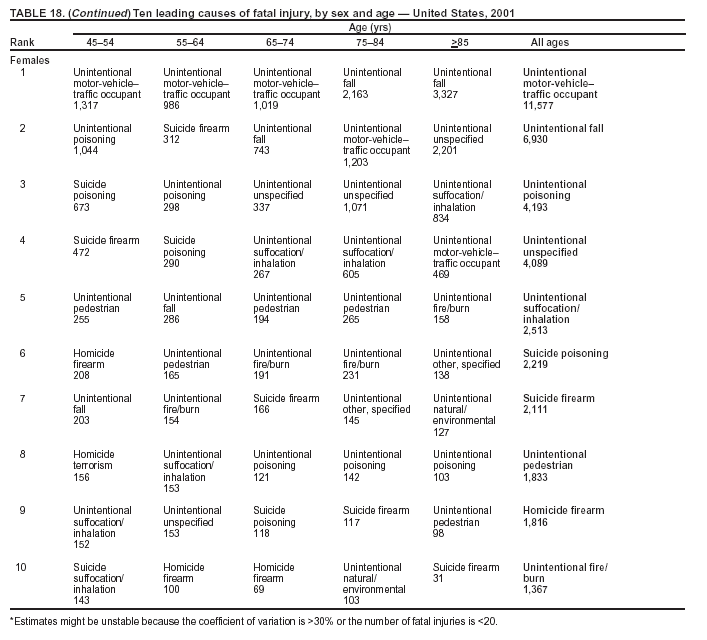
Because dog bites, other bites/stings, and foreign objects account for a considerable number of nonfatal injuries, they were listed as separate subcategories in this report's tables providing information on mechanism of injury. To be comparable with fatal data, dog bites and other bites/stings were grouped into the natural/environmental category, whereas foreign objects were included in other, specified, injuries. Gunshot injuries were separated into firearm and BB/pellet gun categories; however, BB/pellet gunshot deaths were not presented because they cannot be uniquely identified by using the ICD-10 classification system. Nature of Injury For nonfatal injuries, data are presented by injury diagnosis and primary body part affected, using a simplified version of the Barell matrix for body region and diagnosis (17). Although NEISS-AIP and NEISS data were not coded by using ICD-9-CM diagnosis codes, nature of injury data for each patient were collected and recorded in well-defined categories for both the principal diagnosis and primary body part affected. These categories were collapsed to be consistent with those in the Barell matrix. Leading Causes of Fatal and Nonfatal Injuries NCHS is developing standard definitions for defining leading causes of fatal and nonfatal injuries. The definitions used in this report might differ from the standards being developed. For instance, in this report, MV-traffic occupant injuries are ranked to account for the coding scheme for mechanism of injury used in the NEISS-AIP. Statistical MethodsFor fatal injuries, NVSS provides a census of all injury deaths from death certificates filed from all 50 states and the District of Columbia. For nonfatal injuries, national estimates were obtained by summing the sample weights of injured persons in the NEISS-AIP and NEISS data sets. A sample weight is calculated for each injured person treated at an NEISS hospital on the basis of the inverse of the probability of selection of that hospital. In addition, sample weights are adjusted for nonresponse and poststratified to adjust for changes in the annual number of ED visits over time (6). Rates for both fatal and nonfatal injuries were calculated by using 2001 bridged race population† estimates from the U.S. Census Bureau. Fatal injury rates in this report might be different from those previously reported by NCHS (18) because a different series of 2001 bridged race population estimates was used. Fatal and nonfatal injury rates are presented as rates per 100,000 population, whereas case-fatality rates (CFRs) are presented as a percentage of injured persons (i.e., calculated as fatal injuries divided by the sum of fatal and nonfatal injuries multiplied by 100). The age-adjusted rates were computed through the direct method by using the year 2000 standard (19). Standard errors (SEs) used to produce 95% confidence intervals (CIs) for the rates were computed differently for the fatal injury, nonfatal injury other than gunshot injuries, and nonfatal firearm and BB/pellet gunshot injuries. For the nonfatal injuries, SEs for the estimates were computed by means of a direct variance estimation procedure, except for firearm and BB/pellet gun injuries, in which case SUDAAN (20) was used. Both of these methods account for the complex sample designs of NEISS-AIP and NEISS. Fatal injuries, as infrequent events, were assumed to follow a Poisson distribution. Therefore, SE of the fatal injuries was computed so that where D is the number of deaths (18). CIs of the fatal injury rates were computed as follows: National counts or estimates determined to be unstable are indicated with a footnote in the tables. Fatal injuries were identified as unstable if the number of deaths was <20 or the coefficient of variation (CV) was >30%, where CV = (SE / number of deaths) × 100. Nonfatal injuries were identified as unstable if the national estimate was <1,200, the number of sample cases used was <20, or CV was >30%, where CV = (SE / national estimate) × 100 (6). In certain instances, fatal and nonfatal injury data were combined to present total national estimates and rates by selected characteristics. To calculate SEs of these total estimates, SEs were calculated separately for fatal and nonfatal injuries. Assuming independence, each of these SEs was squared to obtain each variance, which was then summed to get the variance of the total combined number of fatal and nonfatal injuries by selected characteristics (18,21). The same procedures described previously were then applied to compute CIs and CVs for these combined national estimates and rates. ResultsFatal and Nonfatal Injuries, by Sex, Age, and Race/EthnicityIn 2001, a total of 157,078 persons (age-adjusted rate of 54.9/100,000 population) died from an injury, and an estimated 29,721,821 persons with nonfatal injuries (age-adjusted rate of 10404.3/100,000) were treated in U.S. hospital EDs. The age-adjusted fatal injury rate for males (81.2/100,000) was 2.6 times higher than that for females (30.8/100,000), and the age-adjusted nonfatal injury rate for males (11,643/100,000) was 1.3 times higher than that for females (9,077/100,000) (Tables 2 and 3). Although the injury death rate was highest for persons aged >85 years, age-specific nonfatal injury rates were highest for persons aged 15--19 years. For fatal injuries, age-specific injury rates were greater for males when compared with females across all age categories. For nonfatal injuries, age-specific rates were higher for males aged <65 years but higher for females aged >65 years (Figures 1 and 2) (Table 3). For race and ethnicity, fatal injury rates were highest among blacks (Table 3). CFR for males was greater than or equal to that of females across all age categories (0.66 for males versus 0.36 for females) (Figure 3) (Table 2). CFRs increased with age with the highest rate being among persons aged >85 years (range: from 0.15 for children aged <4 years to 2.04 for adults >85 years) (Table 2). Fatal and Nonfatal Injuries, by Intent of Injury, Age, and SexUnintentional injury accounted for a majority of fatal (64.6% overall) and nonfatal (92.7% overall) injuries across all age groups; however, the percentage of violence-related fatal and nonfatal injuries varied by age. The highest percentages of violence-related fatal and nonfatal injuries were identified among those aged 15--44 years (Figures 4 and 5) (Table 4). The age-adjusted fatal injury rates for males more than doubled those for females across all intents of injury (age-adjusted fatal injury rates/100,000 for males and females by intent: unintentional, 49.3 and 22.8; assault, 11.1 and 3.3; and self harm, 18.1 and 4.0, respectively) (Figure 6) (Table 5). The age-adjusted nonfatal injury rate for males was 1.3 and 1.5 times higher than that for females for unintentional and assault-related injuries, respectively (age-adjusted nonfatal injury rate/100,000 for males and females by intent: unintentional, 10751.5 and 8458.7; assault, 769.1 and 504.4, respectively). However, for self-harm, the age-adjusted nonfatal injury rate for females was 1.3 times higher than that for males (age-adjusted nonfatal injury rate/100,000 population for males and females for self-harm: 99.7 and 126.0, respectively) (Figure 7) (Table 5). For unintentional injuries, the fatal injury rates were lowest among children aged 5--9 years (6.3/100,000 population) and highest among persons aged >75 years (146.0/100,000) (Figure 8) (Table 5). The fatal injury rate for persons aged >75 years was more than three times greater than that for any other age group. Nonfatal injury rates were lowest for those persons aged 65--74 years (5631.6/100,000) and highest for those persons aged 15--19 years (13506.0/100,000) (Figure 9) (Table 5). For violence-related injuries, homicide rates were highest for persons aged 20--24 years (17.6/100,000) and lowest for persons aged 5--9 years (0.7/100,000). In contrast, suicide rates were highest for persons aged >75 years (17.4/100,000) and lowest for persons aged 10--14 years (1.3/100,000) (Figure 10) (Table 5). Nonfatal assault-related injury rates were highest for persons aged 15--24 years and lowest for those aged >65 years. Nonfatal self-harm--related injury rates were also highest for those aged 15--24 years, but lowest for children aged <9 years (Figure 11) (Table 5). For both sexes combined, CFR was highest for self-harm--related injuries (8.66%), followed by assault-related injuries (1.12%), and unintentional injuries (0.37%) (Figure 12) (Table 6). CFR for males was higher than that for females across all categories of intent (i.e., 1.5 times higher for the unintentional injury, 2.1 times higher for assault-related injuries, and 4.6 times higher for self-harm--related injuries). Fatal and Nonfatal Injuries, by Intent, Mechanism of Injury, and SexFor unintentional mechanisms of injury, the overall fatal injury rate was highest for the MV-traffic occupant (11.7/100,000), fall (5.3/100,000), poisoning (4.9/100,000), and pedestrian (2.2/100,000) categories, whereas the overall nonfatal injury rate was highest for the fall (2746.7/100,000), struck by/against (1615.9/100,000), overexertion (1222.3/100,000), and MV-traffic occupant (1037.2/100,000) categories (Table 7). For assault-related mechanisms of injury, the fatal injury rate was highest for the firearm gunshot (4.1/100,000) and terrorism (1.0/100,000) categories, and the nonfatal injury rate was highest for the struck by/against (517.7/100,000) and cut/pierce (48.7/100,000) categories (Table 7). For self-harm--related mechanisms of injury, the overall fatal injury rate was greatest for firearm gunshot (5.9/100,000) and suffocation/inhalation (2.2/100,000) categories, whereas the nonfatal injury rate was highest for the poisoning (75.6/100,000) and cut/pierce (22.0/100,000) categories (Table 7). These leading mechanisms by intent of injury were similar for males and females. CFRs varied by mechanism of injury within the sex and intent variables. For unintentional injury, CFRs for males exceeded that for females for all mechanisms of injury, except for the motorcyclist (males, 2.34; females, 2.49) and firearm gunshot (males, 8.01; females, 11.99) categories; CFRs were highest for the drowning or submersion (36.57), suffocation/inhalation (11.92), and firearm gunshot (8.40) categories (Figure 13) (Table 6). For assault-related injury, the overall CFR was greater for males (1.41) than for females (0.66); however, CFR for females was greater than that for males for the cut/pierce (males, 1.33; females, 1.61), firearm gunshot (males, 23.99; females, 29.81), and suffocation/inhalation (males, 26.75; females, 36.09) categories. The assault-related CFR was highest for the suffocation/inhalation (32.13) and firearm gunshot (24.74) categories (Figure 14) (Table 6). For self-harm--related injury, CFR for males exceeded that of females for all mechanisms of injury. Mechanisms of self-harm--related injuries with the highest CFRs were the firearm gunshot (84.99), suffocation/inhalation (69.19), and fall categories (31.22) (Figure 15) (Table 6). Fatal and Nonfatal Injuries, by Intent, Mechanism of Injury, and AgeThe distributions of mechanisms for unintentional and violence-related injuries varied substantially by age group. For unintentional injury deaths, mechanisms with the highest rates were the MV-traffic occupant (26%), drowning (fatal and nonfatal) (17%), suffocation/inhalation (14%), and pedestrian (12%) categories for persons aged <14 years. The leading contributors for other age groups were the categories MV-traffic occupant (64%) for persons aged 15--24 years; MV-traffic occupant (35%) and poisoning (24%) for persons aged 25--64 years; and fall (36%), MV-traffic occupant (18%), and suffocation/inhalation (11%) for persons aged >65 years (Figure 16) (Tables 8 and 9). For nonfatal unintentional injury, mechanisms with the highest rates were the fall (36%) and struck by/against (22%) categories for persons aged <14 years. The highest rates among other age groups were for the fall, struck by/against, overexertion, and MV-traffic occupant categories for persons aged 15--64 years, and predominantly falls (63%) for persons aged >65 years (Figure 16) (Table 8 and 9). For fatal assault-related injuries, the leading mechanisms of injury for all age groups were the firearm gunshot (11,671), terrorism (2,922), cut/pierce (1,971), suffocation/inhalation (690), and struck by/against (341) categories (Tables 6 and 7). Firearm gunshot injuries accounted for 80% of homicides among persons aged 15--24 years (Figure 17) (Tables 10 and 11). The leading mechanisms of nonfatal assault-related injury across all age groups were the struck by/against (1,476,961) and cut/pierce (138,839) categories (Tables 6 and 7). For suicide, the leading mechanism of injury for all age groups was the firearm gunshot (16,869) category, followed by the suffocation/inhalation (6,198) and poisoning (5,191) categories (Tables 6 and 7); however, suffocation/inhalation suicides (169) superseded firearm suicides (90) for those persons aged <14 years (i.e., the majority were aged 10--14 years), whereas poisoning suicide (2,547) was more common than suffocation/inhalation suicide (1,887) among those persons aged >45 years (Figure 18) (Tables 10 and 11). Poisoning (215,814) and cutting/piercing (62,817) were the leading mechanisms of injury for nonfatal self-harm--related injuries (Tables 6 and 7). Fatal and Nonfatal Injuries, by Disposition at ED Discharge or DeathAs a crude measure of severity of injury, fatal and nonfatal injuries were examined by disposition at ED discharge (i.e., treated and released, hospitalized/transferred, and other) or death. For unintentional injury, the majority were treated and released (94.5%) from a hospital ED. Among persons treated for unintentional injury in a hospital ED, 4.8% of persons were hospitalized/transferred to another facility for specialized care, and <0.3% of persons were held for observation. Unintentional injury deaths accounted for <0.4% of all injuries reported. Mechanisms of unintentional injury that resulted in more severe outcomes were drowning (fatal and nonfatal) (34.2% were hospitalized/transferred, and 36.6% died) and firearm gunshot (28.6% were hospitalized/transferred, and 8.4% died) (Figure 19) (Tables 12 and 13). For assault-related injury, the majority were also treated and released. However, injuries related to the firearm gunshot (38.6% were hospitalized/transferred, and 24.7% died) category and the suffocation/inhalation (8.5% were hospitalized/transferred, and 32.1% died) category resulted in a higher percentage of hospitalizations and deaths (Figure 20) (Tables 12 and 13). For self-harm--related injury, the majority of cases were treated and released (37.8%) or hospitalized/transferred (52.1%); however, the percentage of suicide attempts resulting in death was notably high for the firearm gunshot (85.0%) and suffocation/inhalation (69.2%) categories (Figure 21) (Tables 12 and 13). Nonfatal Injuries, by Primary Body Part Affected, Principal Diagnosis, and Locale Where Injury OccurredFor nonfatal injuries, the most common primary body parts affected by a nonfatal injury were the head or neck (29.5% for males and 26.1% for females), arm or hand (28.3% for males and 24.7% for females), and leg or foot (19.6% for males and 24.2% for females) (Tables 14 and 15). Also, the number of nonfatal injuries to the head/neck (males, 4,884,573; females, 3,431,631) and arm/hand (males, 4,675,661; females, 3,254,890) regions for males was 1.4 times higher than that for females (Figure 22) (Tables 14 and 15). For males, the three most common primary diagnoses were laceration/puncture (25.8%), strain/sprain (20.2%), and contusion/abrasion (18.3%). Likewise for females, the three most common primary diagnoses were strain/sprain (26.1%), contusion/abrasion (21.7%), and laceration/puncture (16.9%) (Tables 14 and 15). Approximately twice as many males were treated for lacerations/punctures as females (males, 4,274,595; females, 2,219,492) (Figure 23) (Tables 14 and 15). Overall, approximately one of three nonfatal injuries were reported to occur in a home, with even higher percentages for children aged <14 years and adults aged >65 (Tables 14 and 15). However, for approximately 28% of nonfatal injury incidents, the locale where the injury occurred was unknown. Using a simplified version of the Barell matrix of body region by injury diagnosis (17), the distributions of nonfatal injuries by primary body part affected and principal diagnosis are presented over all mechanisms combined and for selected mechanisms of injury; these distributions were similar for males and females, but varied by specific mechanisms (Tables 16 and 17). When the distribution of primary body part affected was examined by major principal diagnosis categories (Figure 24), results indicated that 97% of internal nonfatal injuries involved the head/neck region. Nonfatal injuries to the head/neck region also accounted for a substantial percentage of lacerations/punctures (40%), contusions/abrasions (30%), and burns (25%). Fractures occurred mainly to the extremities (i.e., 46% to the arm/hand and 28% to the leg/foot). Dislocations primarily involved the arm/hand (39%) and upper trunk (42%), including the shoulder. Sprains/strains and burns also commonly involved the extremities. Internal injuries accounted for 15% of injuries to the head/neck region (Figure 25). Fractures, dislocations, and sprains/strains were the principal diagnoses for greater than half of all injuries to the lower extremities and the upper and lower trunk regions. Lacerations/punctures comprised approximately one third of injuries to the head/neck (31%) and arm/hand (34%) regions. Fatal and Nonfatal Injuries, Leading CausesThe 10 leading causes of fatal and nonfatal injury varied by sex and age (Tables 18 and 19). Across all age groups, unintentional MV-traffic occupant (males, 21,819; females, 11,577) was the leading cause of injury death category, and unintentional fall (males, 3,686,549; females, 4,148,790) was the leading cause of nonfatal injury category for both males and females. The firearm suicide (14,758), unintentional poisoning deaths (9,885), and firearm homicide (9,532) categories ranked high for males, whereas unintentional falls (6,930) and poisoning (4,193) deaths ranked high for females. For females, unintentional MV-traffic occupant injury ranked third as a leading cause of nonfatal injury, but for males, it ranked fifth after the unintentional struck by/against, unintentional overexertion, and unintentional cut/pierce categories. DiscussionFatal and nonfatal injuries are a major public health problem for all U.S. residents, because, in 2001, approximately 157,000 persons died as a result of injury and one in 10 persons was treated for an injury in a U.S. hospital ED. For every death, an estimated 10 persons were hospitalized/transferred for specialized medical care, and 178 persons were treated and released from a U.S. hospital ED (Figure 26). Although injury deaths accounted for only 0.5% of the estimated 29.7 million injuries treated in hospital EDs in 2001, the lethality of injury varied by sex, age, cause of injury, and intent of injury. Injury CFRs were higher for males than for females across all age groups examined (CFRs for males were 1.8 times higher than that for females). Persons aged >85 years had the highest lethality from injury (CFR: 2.38). External causes of injury with the highest lethality were firearm-related suicide (CFR: 85.0), suffocation/inhalation suicide (CFR: 69.2), unintentional drowning (CFR: 36.6), suffocation/inhalation assault (CFR: 32.1), fall-related suicide (CFR: 31.2), and firearm-related assault (CFR: 24.7). The leading causes of fatal and nonfatal injury also varied by sex and age. The leading cause of fatal injury across all age groups and for both sexes was the unintentional MV-traffic occupant category. For nonfatal injuries, unintentional MV-traffic occupant was the fifth leading cause for males and the third leading cause for females. Unintentional falls were the leading cause of nonfatal injuries, and injury rates from unintentional falls were particularly high for children aged <14 years and for older adults (persons aged >65 years). Certain fall-related injuries among children were associated with sports and recreation-related activities (22,23). Older persons (those aged >75 years) are particularly vulnerable to long-term disability and death as a result of a fall (24--26). Violence-related deaths also ranked high among the leading causes of injury death. Females were much more likely than males to attempt suicide, with higher nonfatal self-harm injury rates; however, males were more likely to complete suicide, with higher fatal self-harm injury rates (27). For females, poisoning suicide, firearm-related suicide, and firearm-related homicide were among the 10 leading causes of injury death. For males, firearm-related suicide, firearm-related homicide, and suffocation/inhalation suicide were among the 10 leading causes of injury death. Fatal and nonfatal firearm-related injury rates from interpersonal violence were highest for males aged 15--24 years; fatal firearm-related injury rates from self-harm were highest among males aged >65 years (9). The types of injury treated in hospital EDs and the body parts affected also varied by sex and age. Across all external causes of injury, males were more commonly treated than females for lacerations and fractures, especially to the head/neck region and upper extremities. In contrast, females were more likely than males to be treated in a hospital ED for neck strains; the majority of these injuries occurred among vehicle occupants during MV crashes (28). Females were also more commonly treated than males for fractures and sprains/strains to the lower trunk (including hip fractures), and to lower extremities as a result of unintentional falls. Children aged <14 years accounted for approximately 29% of all thermal and scald burns, 32% of all internal head injuries, and 45% of all dental injuries. Because of the differences in injury rates and CFRs by age and sex, future research should focus on developing a better understanding of the underlying risk factors and behaviors that lead age- and sex-specific differences in the types of injuries and body parts affected as well as in the mechanisms and intent of injury. A greater understanding of these underlying factors will allow development of appropriate age- and sex-specific interventions. These interventions can reduce the disparity among the U.S. population with respect to the risk of injury. Prevention EffortsRecent prevention efforts have focused on reducing the more common causes, as defined by mechanism and intent, of injury identified in this report (e.g., youth suicide, suicide among older persons, violence, intimate partner violence, MV-traffic--related injuries among younger and older drivers, falls among older persons, and injuries among children and adolescents who participate in sports and recreational activities). CDC funds research and prevention efforts aimed at developing and evaluating community-based interventions to reduce fatal and nonfatal injuries for certain populations at high risk (e.g., reduce residential fire-related injuries, reduce intimate partner violence, and reduce child maltreatment). CDC has participated in suicide prevention efforts by conducting surveillance (29), contributing to the U.S. Surgeon General's appeal to prevent suicide (30), and supporting research to evaluate the effectiveness of suicide prevention programs. CDC has produced the most comprehensive set of systematic reviews available on MV injury prevention strategies, resulting in a set of evidence-based recommendations on interventions to increase safety belt and child restraint use and reduce alcohol-impaired driving (31). Prevention efforts to reduce disability and death associated with MV-traffic injuries among adolescents and young adults include programs aimed at graduated driver-licensing programs and reducing drinking and driving among young drivers (32,33). Prevention efforts under way to reduce MV-traffic injuries have targeted reduction of lethal crashes involving older drivers, including gaining an understanding of when and why older drivers voluntarily cease driving. CDC also has been involved in developing a national plan for transportation safety among older U.S. residents (34), and CDC coauthored a report with the World Health Organization and the World Bank (35). Substantial attention has been directed toward preventing falls among older adults. Two of these prevention efforts include the development of a tool kit and publication of a report on prevention programs (36,37). Research is also being conducted to understand risk factors associated with falls among older persons (38--42). In addition to MV-traffic and falls, other major external causes of injury (e.g., firearm-related injury [43--48], poisoning [49,50], drowning [51], fire and flame [52], youth violence [53], and homicide [54--56]) have been targeted for prevention efforts in Healthy People 2010 (57). CDC is working collaboratively with other federal agencies to monitor changes in fatal and nonfatal injury rates across time and to coordinate research and prevention efforts aimed at achieving these injury-related objectives. Lethality of the cause of injury has historically been a key consideration in setting priorities for injury prevention efforts. For instance, prevention efforts have targeted particular causes of injury with high lethality (e.g., the firearm suicide, MV-traffic occupant, and drowning categories). The findings presented in this report demonstrate that deaths are a limited component of the overall injury problem in the United States. Beyond lethality, prevention efforts should consider factors leading to nonfatal injury that require medical treatment when setting priorities to determine where limited resources should be spent to reduce injuries and to determine the impact of injuries on society. Nonfatal injuries treated in EDs can result in substantial morbidity and costs in terms of hospitalization and in short- and long-term health effects (58--60). Prevention efforts should focus not only on external causes of injury that are lethal, but also on those nonfatal injuries that can have particularly high economic and social costs (4,61,62). The databases used for this report lacked information on the short- and long-term effects of nonfatal injuries, indicating the need for better data on long-term outcomes (e.g., loss of activity, permanent physical and mental impairments, and long-term disabilities). These data can be obtained by inclusion of questions in national household surveys (e.g., the National Health Interview Survey conducted by NCHS [63]). Population-based surveillance for fatal and nonfatal injuries at the state and local levels is also needed for use in monitoring injuries and for use in prevention program planning and evaluation. Twenty-six U.S. states have hospital discharge data sets, but only nine states have hospital ED data sets (64,65). Efforts are under way to standardize how injury data are analyzed and reported from statewide hospital discharge systems for injury surveillance purposes (66,67). National injury data from NVSS and NEISS-AIP can serve as baseline data for comparison with data reported at the state and local level to identify community-based injury problems and allocate limited resources to high-priority areas. LimitationsThis study includes certain limitations of the data. First, the nonfatal data are only representative of those injuries treated in hospital EDs and do not include data related to injured persons treated in outpatient or other health-care facilities, those hospitalized without being treated in an ED, or those not receiving medical care. Second, NEISS-AIP only provides national estimates and cannot be used to provide estimates at the regional, state, and local levels. Third, for nonfatal injuries from NEISS-AIP, mechanism and intent of injury classifications were made by trained coders using standard guidelines based solely on a brief narrative about the injury incident derived from the medical chart. No attempt was made to confirm these classifications by using other data sources (e.g., police accident or crime reports). Finally, nonfatal violence-related injuries (i.e., intentional self-harm and assaults) reported through NEISS-AIP are likely to be underestimated because of a lack of information written in the medical chart to indicate that the injury resulted from a violent event. ED staff members are not always trained in how to identify certain forms of violence (e.g., intimate partner violence, child maltreatment, and sexual violence). Also, patients might not offer details about their injury incident because of fear of further harm or police involvement, or because they might not consider their injury to be the result of violence. ConclusionNationally representative nonfatal injury data from NEISS-AIP are now available to accompany death data from NVSS for use in ongoing monitoring and tracking of fatal and nonfatal injuries across time. Efforts are needed to increase the number of states that have population-based data on ED visits and hospitalizations in state and local jurisdictions for use in injury prevention program planning and evaluation. Overall, in 2001, an estimated 0.5% of injured persons died; however, the lethality of injuries varied substantially by age and sex as well as by the mechanism and intent of injury. Further research is needed to identify age- and sex-specific interventions that can reduce the risk and lethality of injury and decrease the disparity between older and younger persons and between males and females. Population-based data on physical and mental impairments and long-term disabilities are needed. Prevention effort decisions should be based on data on nonfatal injuries as well as injury deaths to better understand the scope of the injury problem and its potential effect on society. References
* The asterisk preceding these codes indicates that the code was introduced by the United States but is not officially part of ICD. Codes *U01--*U03 are terrorism-related. † Bridged race population estimates were obtained from NCHS. They release bridged race population estimates of the resident population of the United States, on the basis of Census 2000 counts, for use in calculating vital rates. These estimates result from bridging the 31 race categories used in Census 2000, as specified in the 1997 Office of Management and Budget (OMB) standards for collecting data on race and ethnicity, to the four race categories specified under the 1977 standards. Certain data-collection systems (e.g., vital statistics) are continuing to use the 1977 OMB standards during the transition to full implementation of the 1997 OMB standards. The bridged race population estimates are produced under a collaborative arrangement with the U.S. Census Bureau. Table 1  Return to top. Figure 1 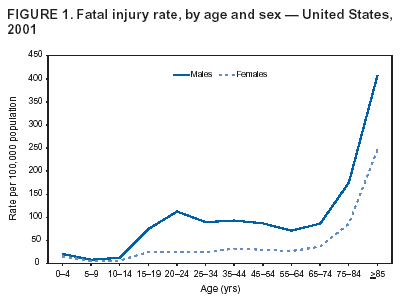 Return to top. Table 2 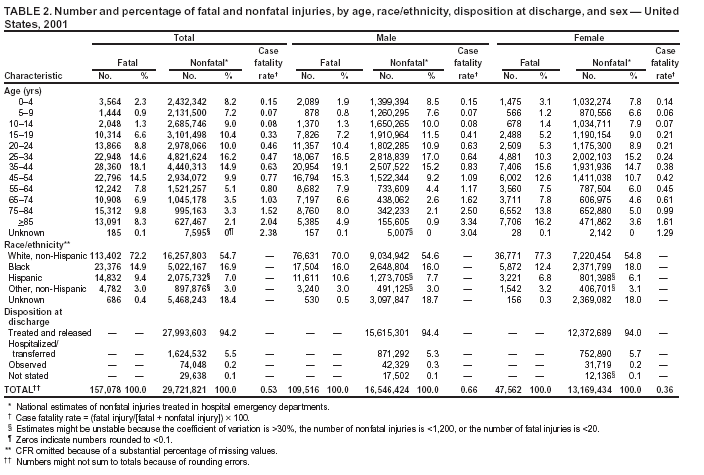 Return to top. Figure 2 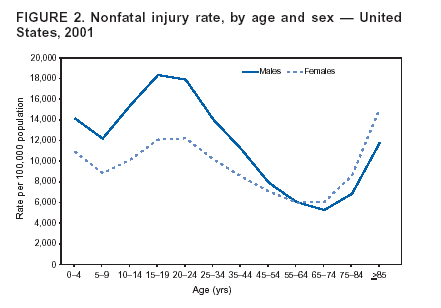 Return to top. Table 3 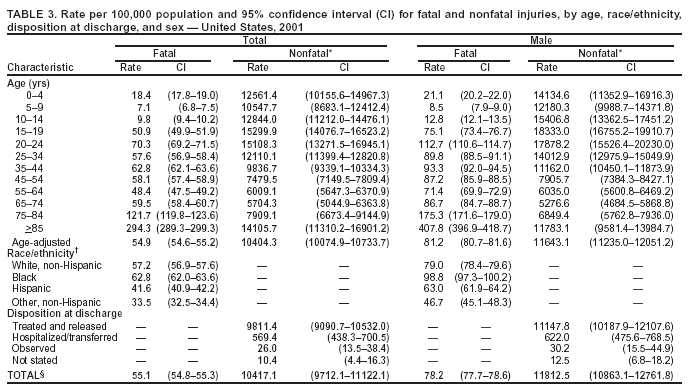 Return to top. Figure 3 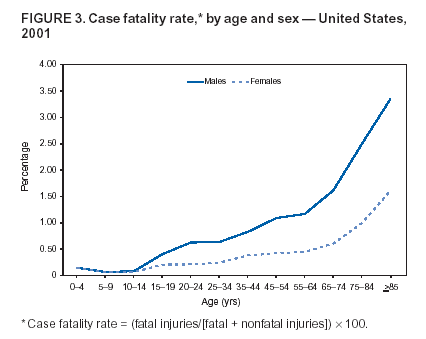 Return to top. Table 4 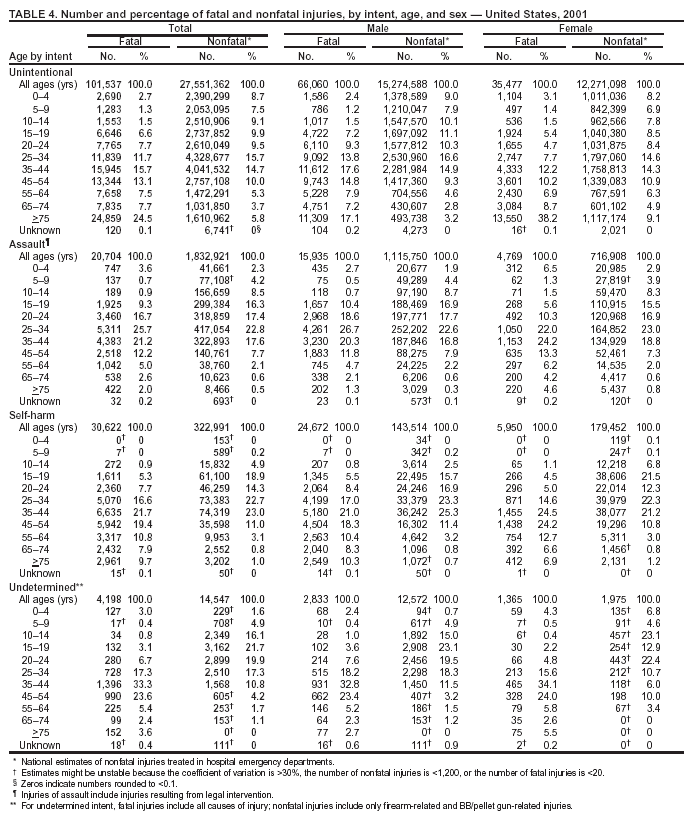 Return to top. Figure 4 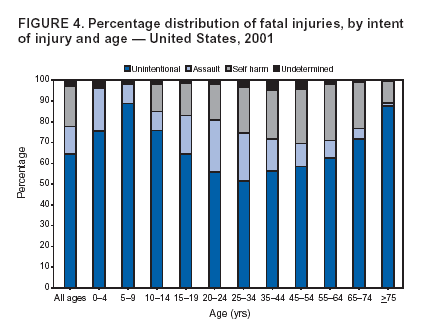 Return to top. Table 5 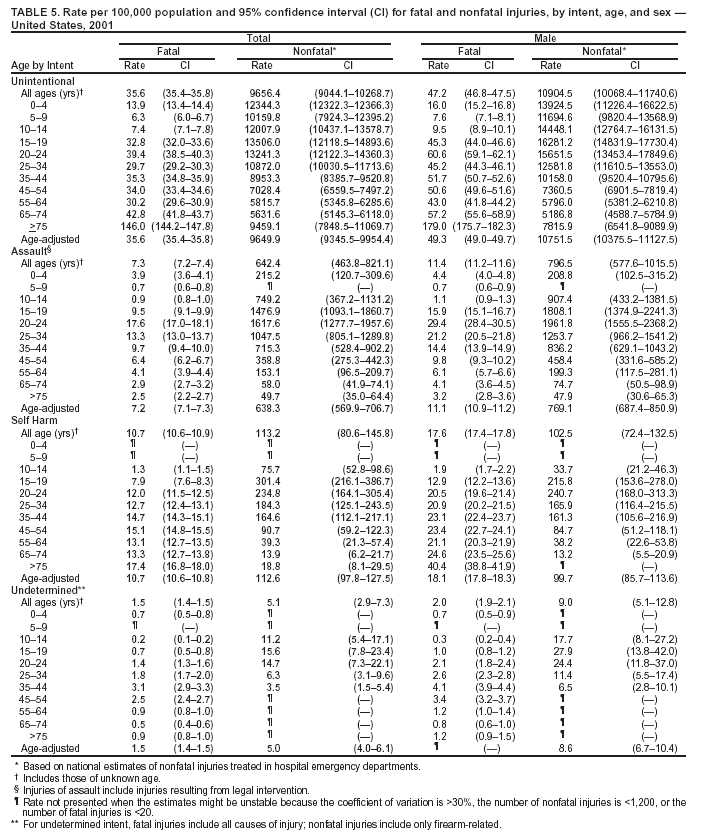
 Return to top. Figure 5 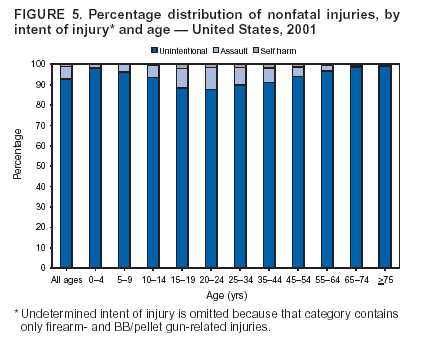 Return to top. Table 6 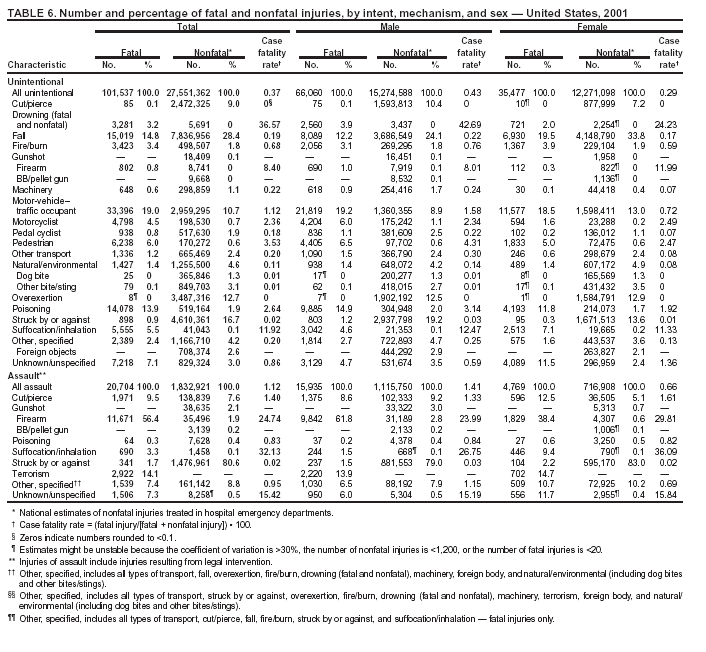 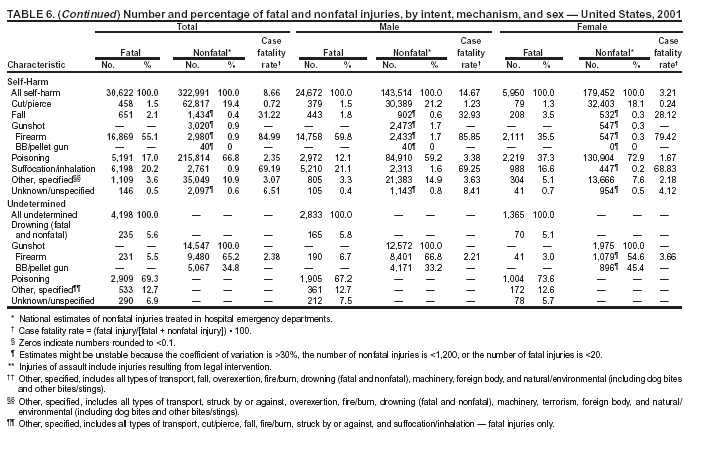 Return to top. Figure 6 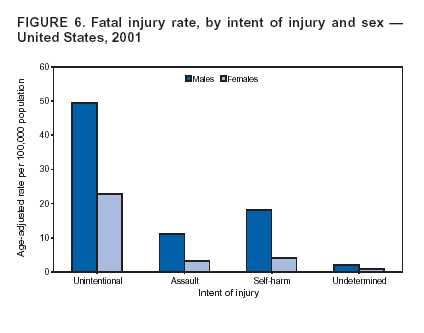 Return to top. Table 7 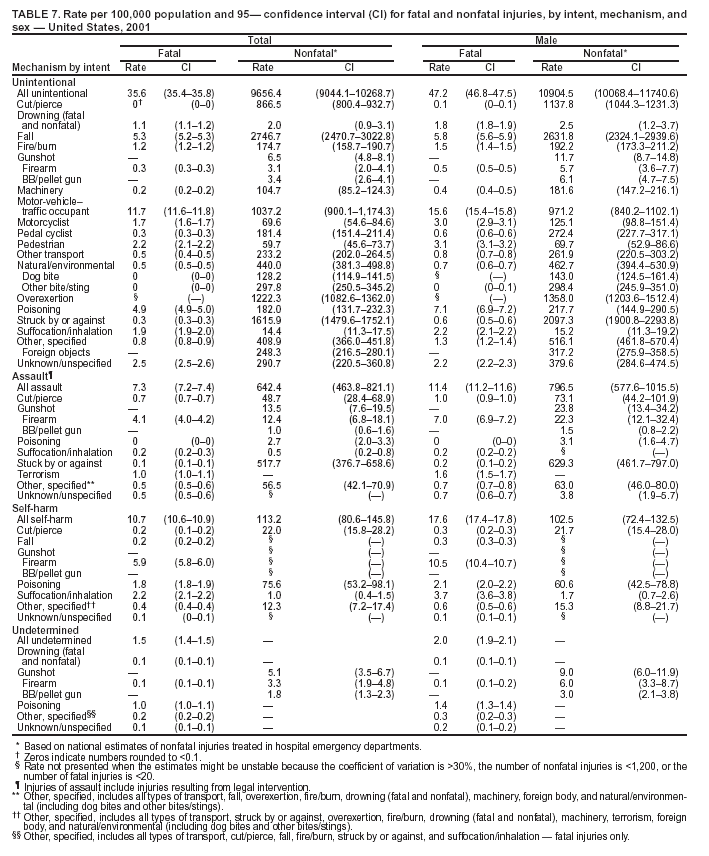 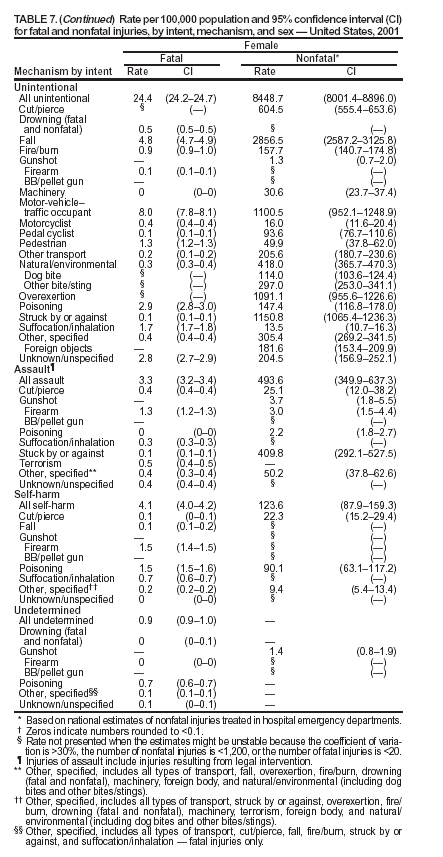 Return to top. Figure 7 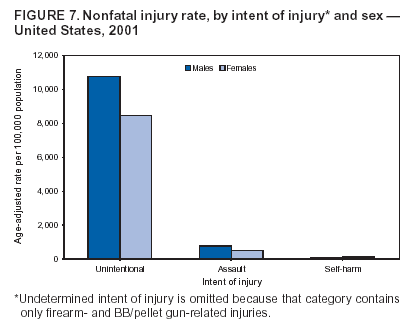 Return to top. Table 8 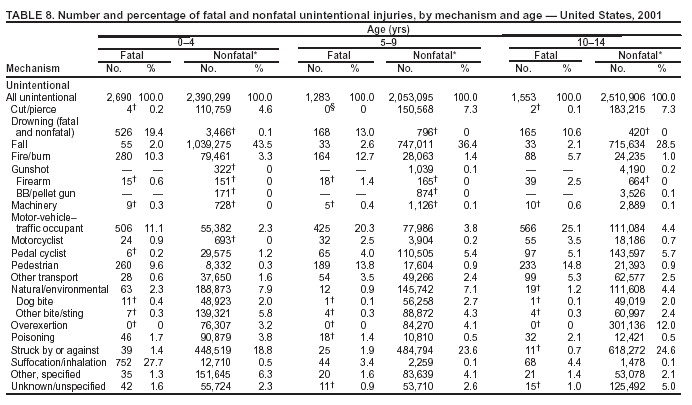 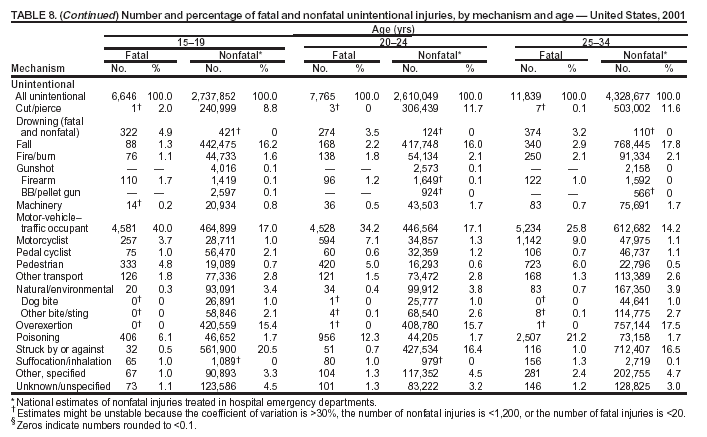 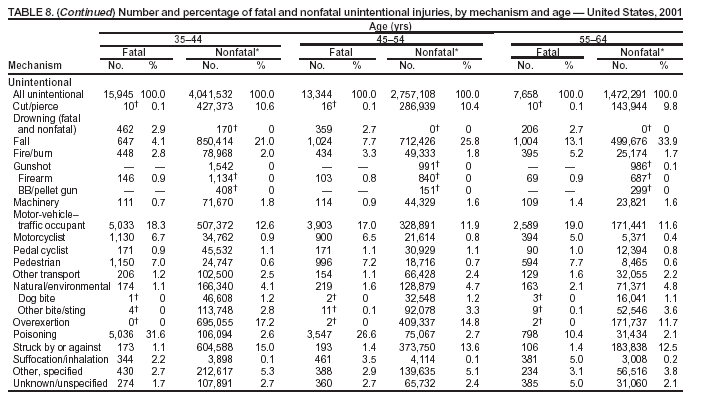 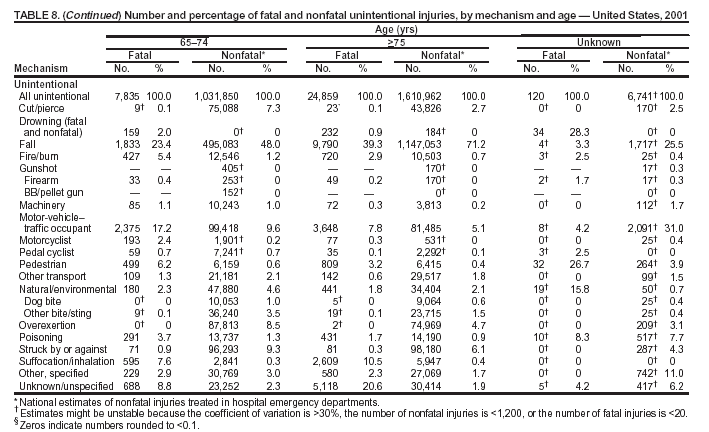 Return to top. Figure 8 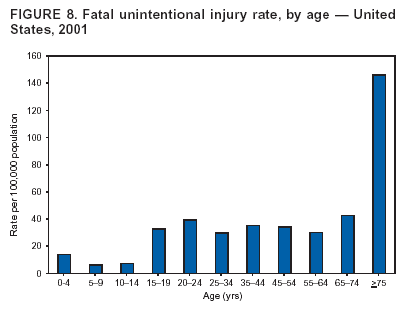 Return to top. Table 9 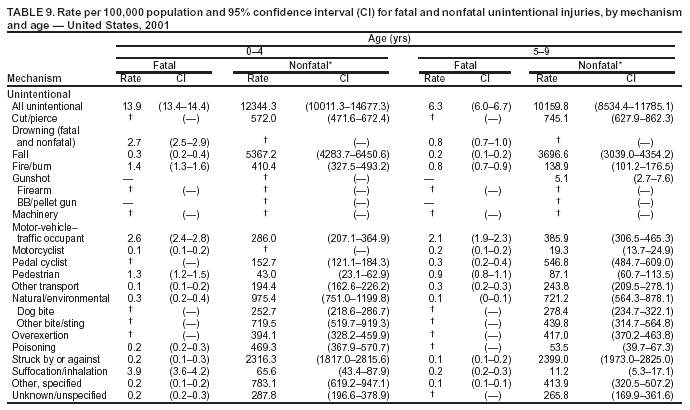 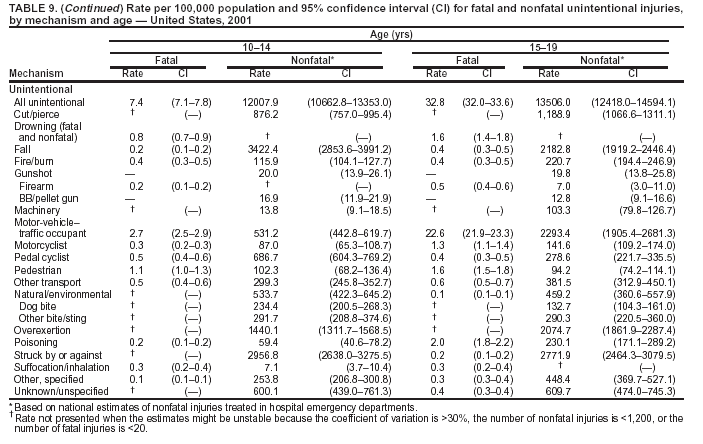 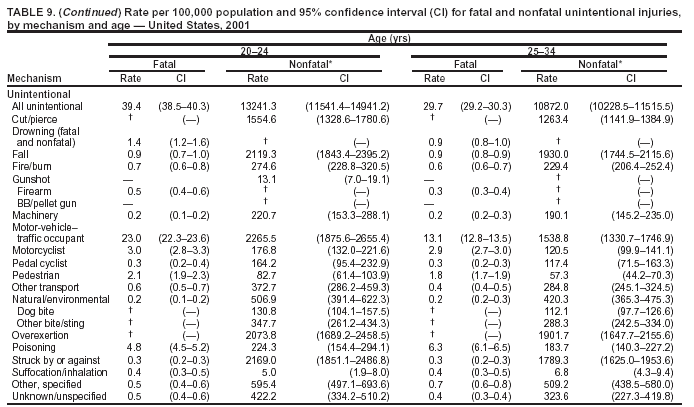 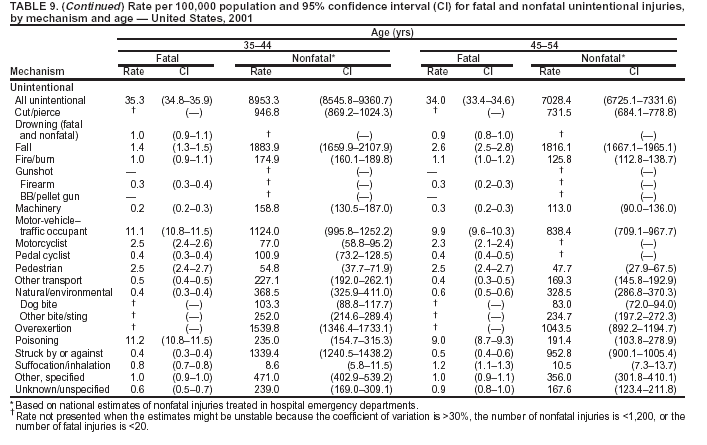 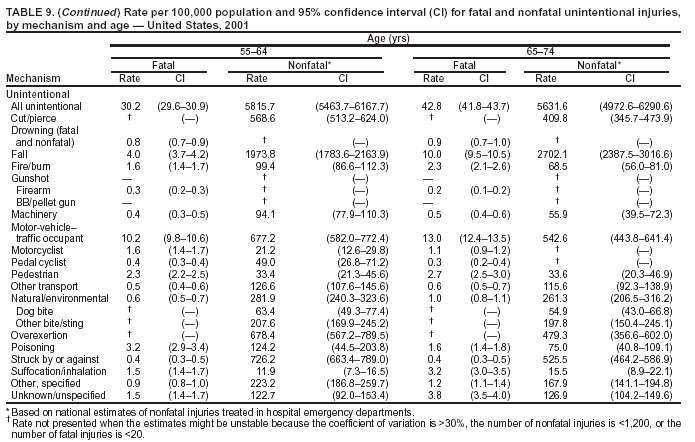 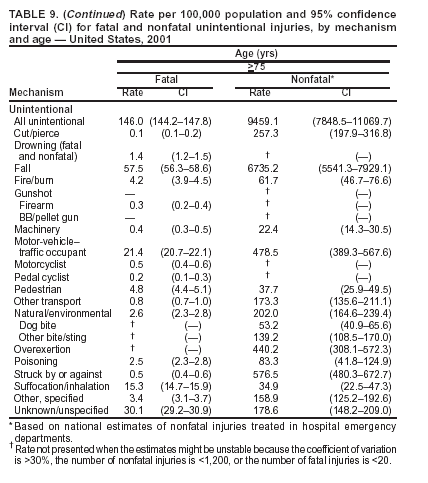 Return to top. Figure 9 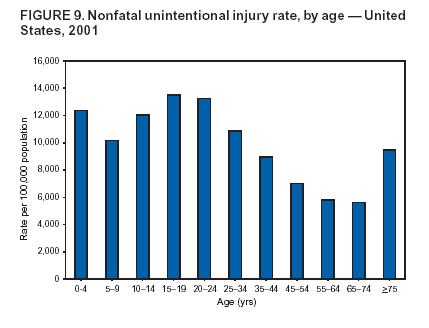 Return to top. Table 10 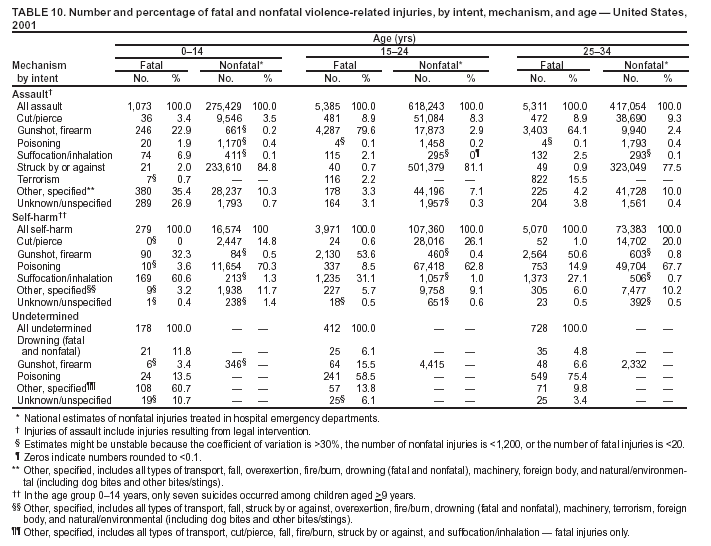
 Return to top. Figure 10 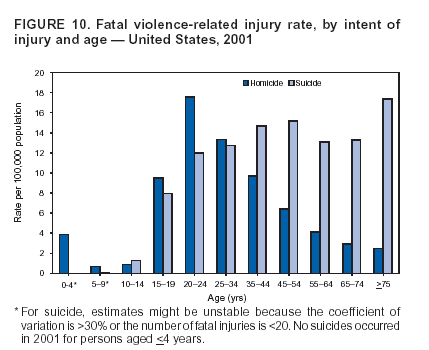 Return to top. Table 11 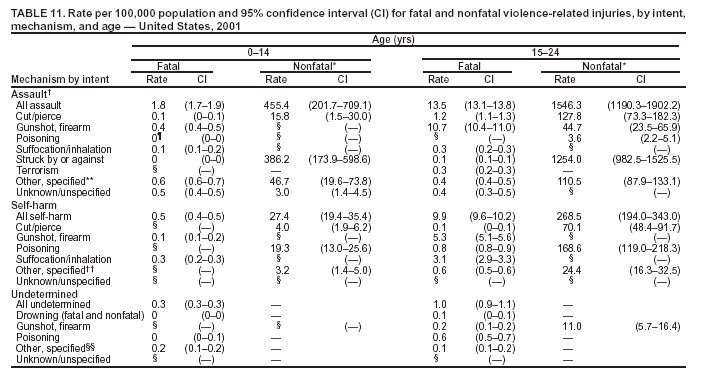 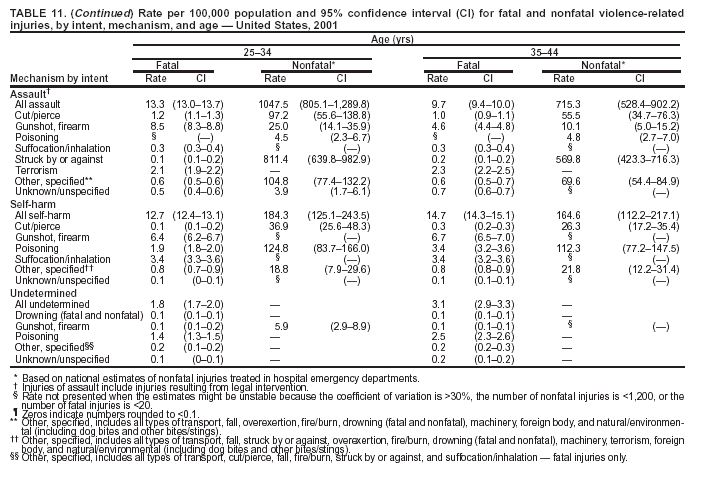 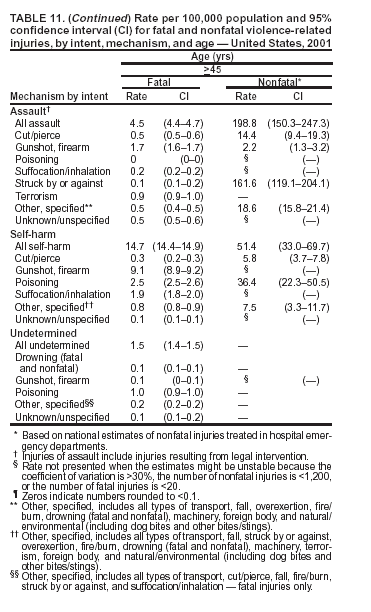 Return to top. Figure 11 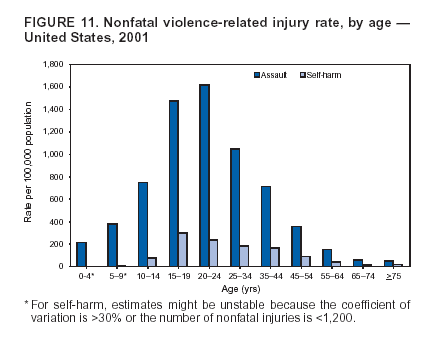 Return to top. Table 12 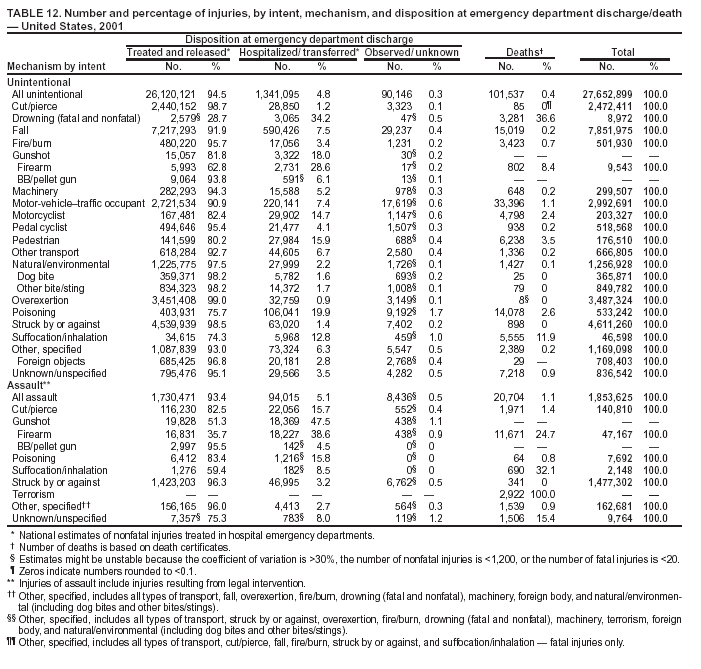 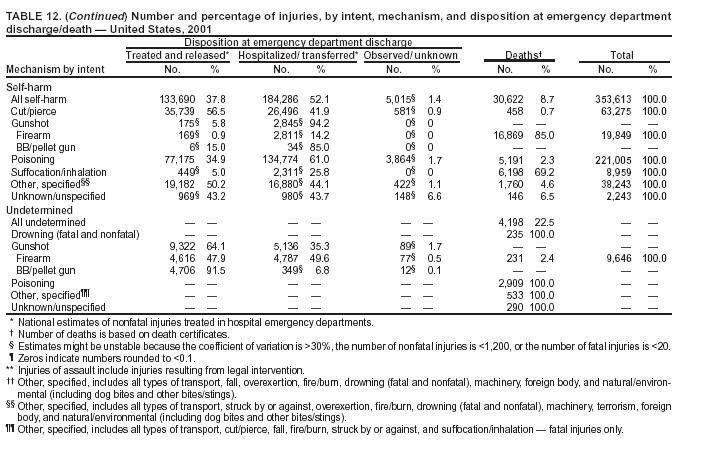 Return to top. Figure 12 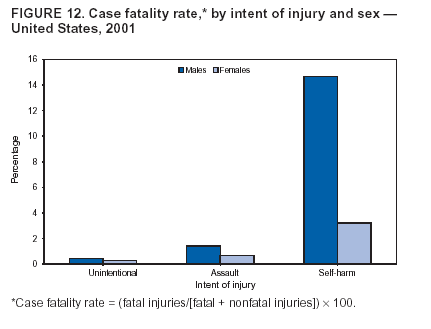 Return to top. Table 13 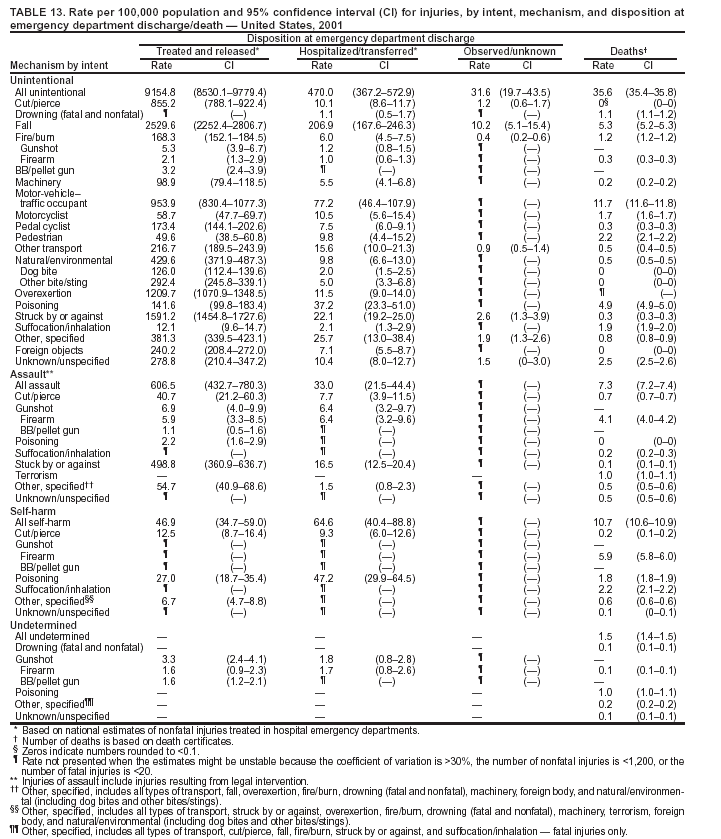 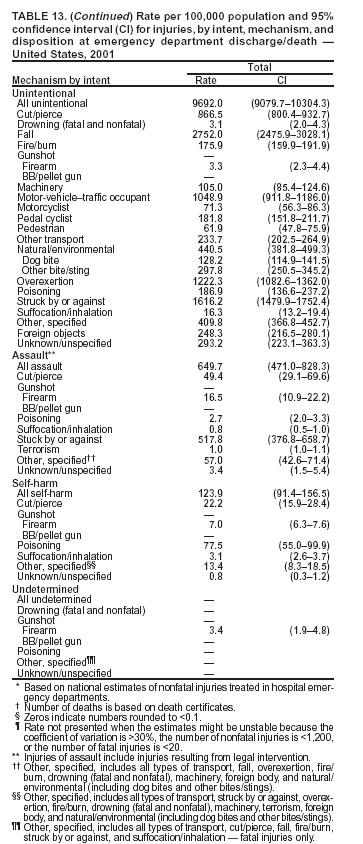 Return to top. Figure 13 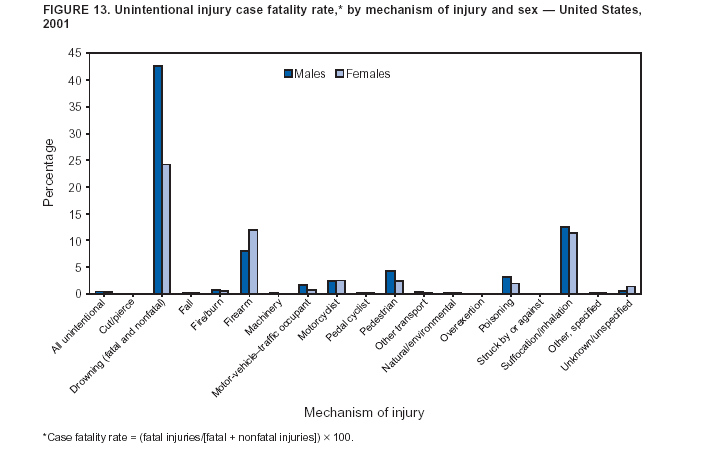 Return to top. Table 14 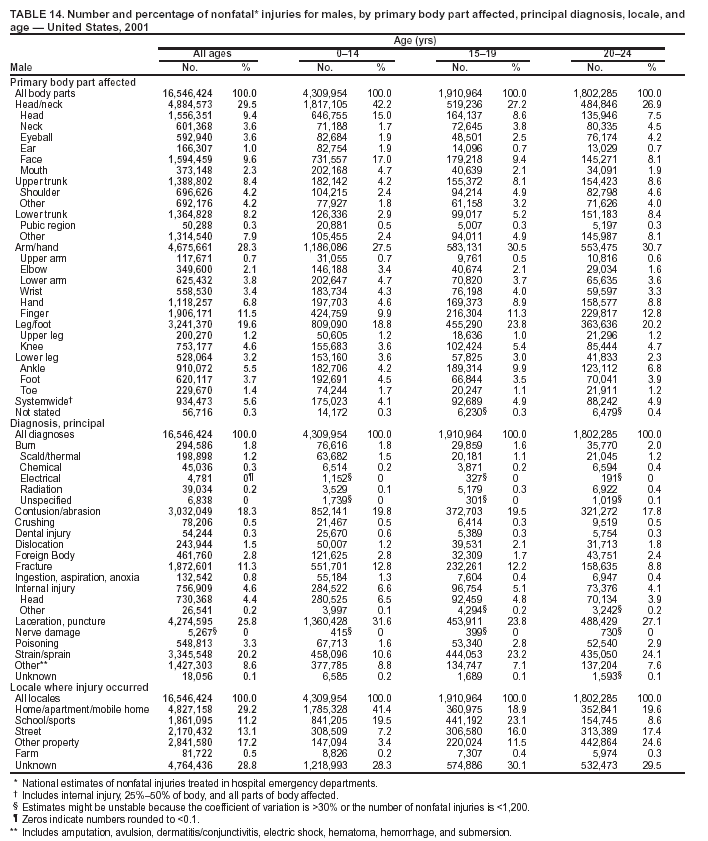 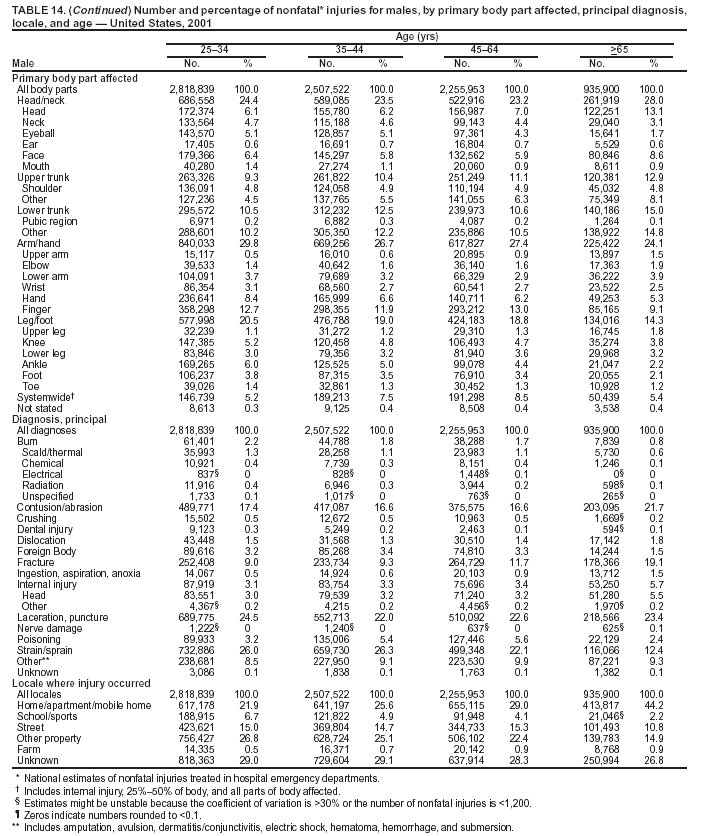 Return to top. Figure 14 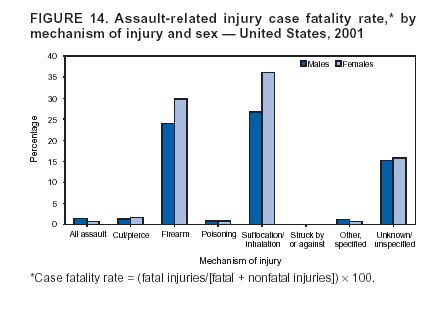 Return to top. Table 15 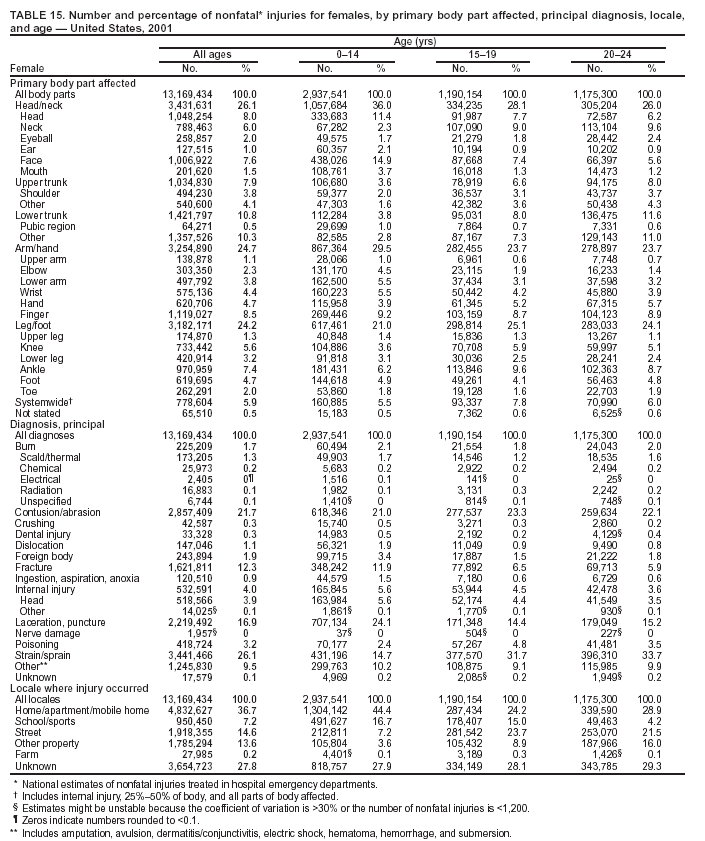 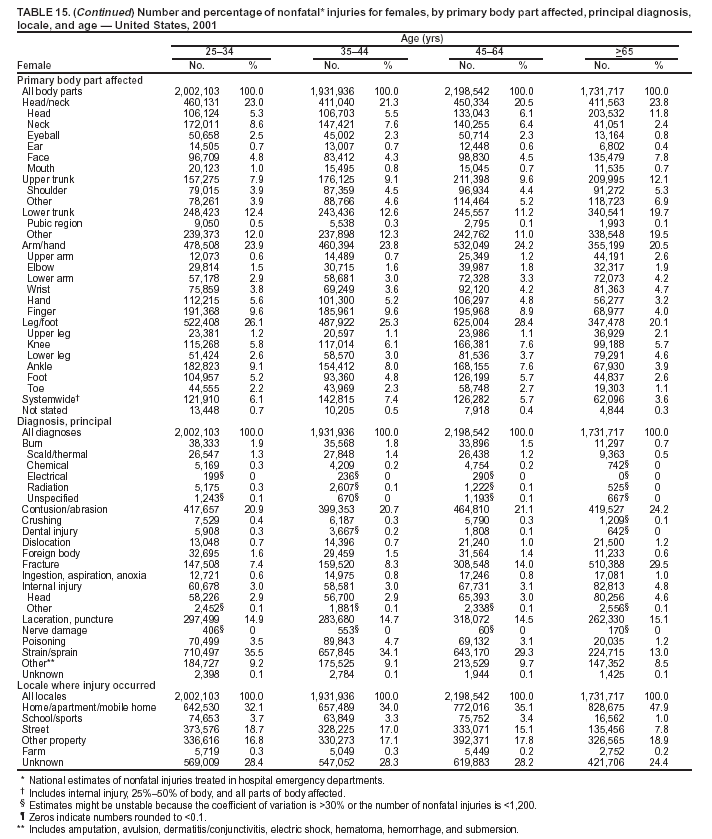 Return to top. Figure 15 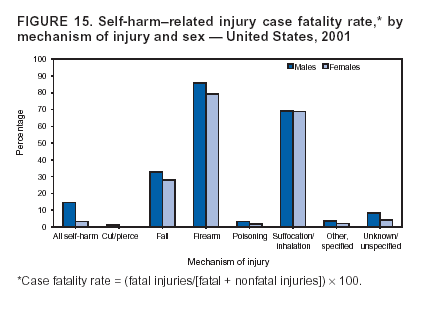 Return to top. Table 16 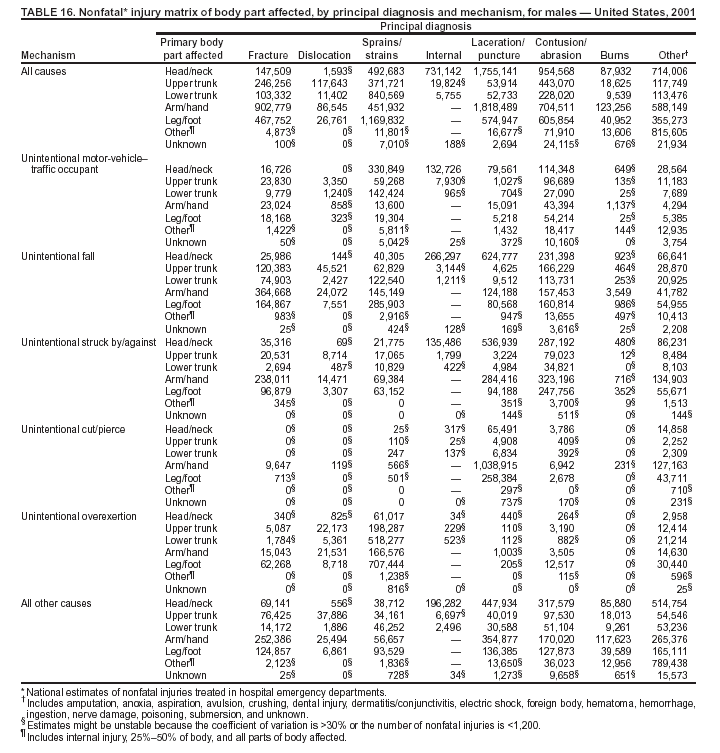 Return to top. Figure 16 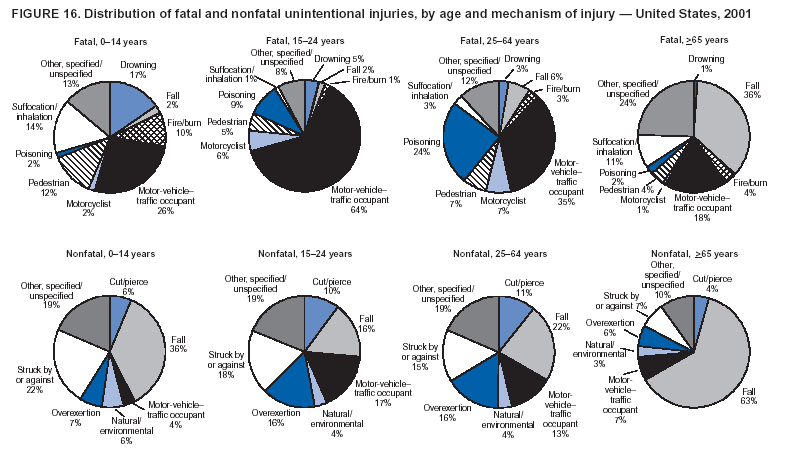 Return to top. Table 17 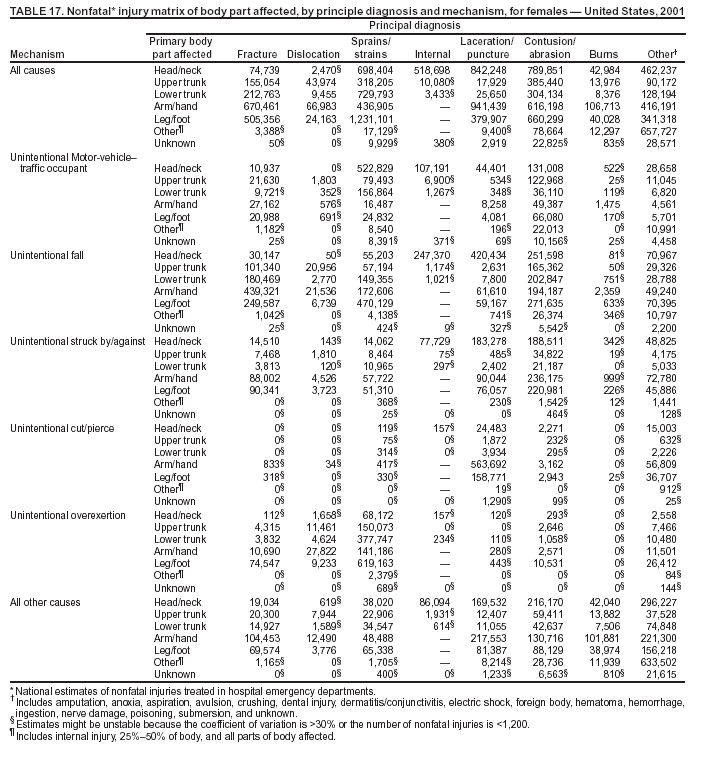 Return to top. Figure 17 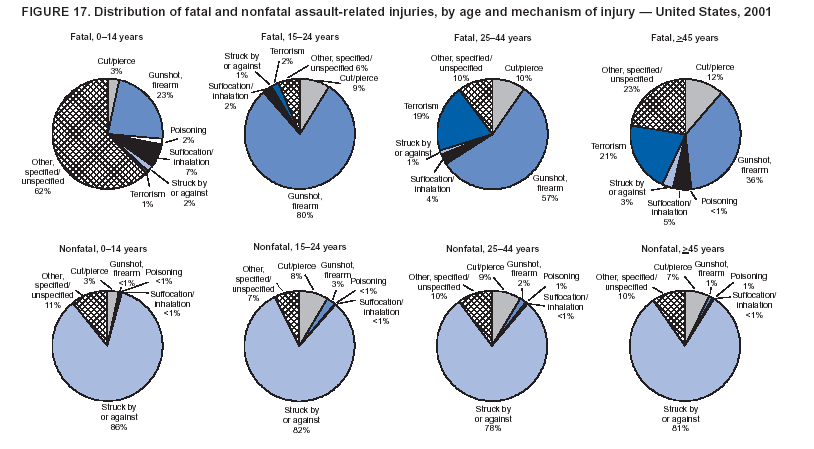 Return to top. Table 18 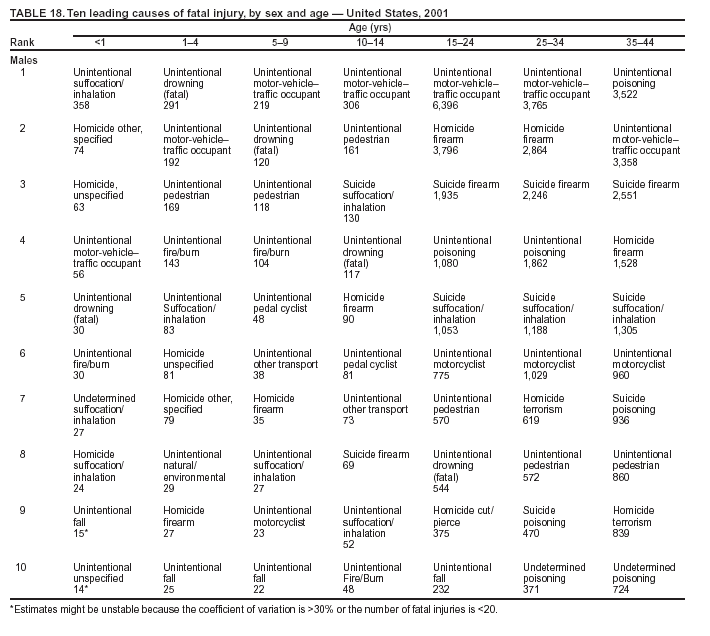 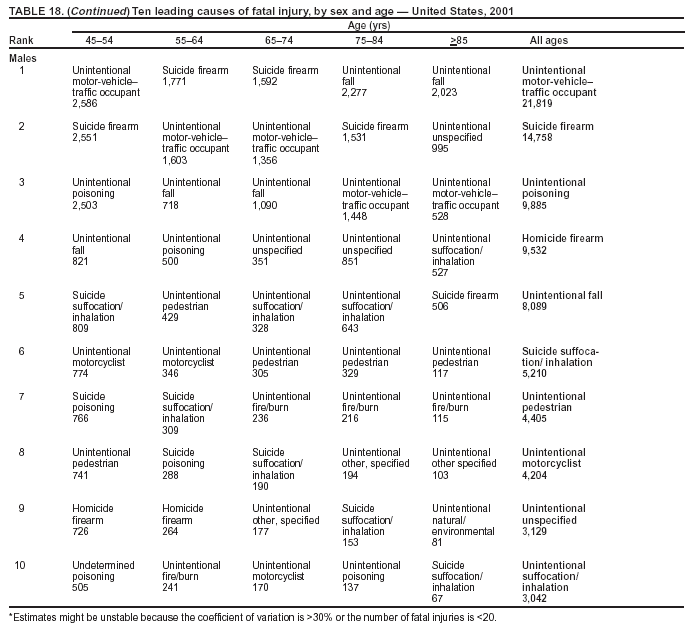
 Return to top. Figure 18 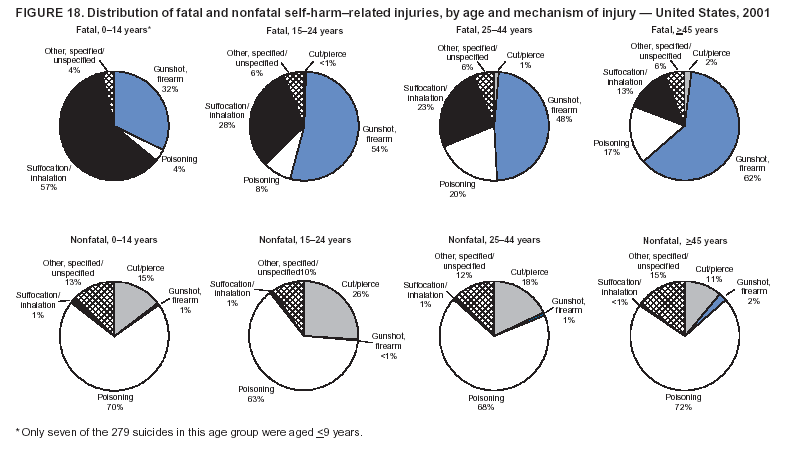 Return to top. Table 19 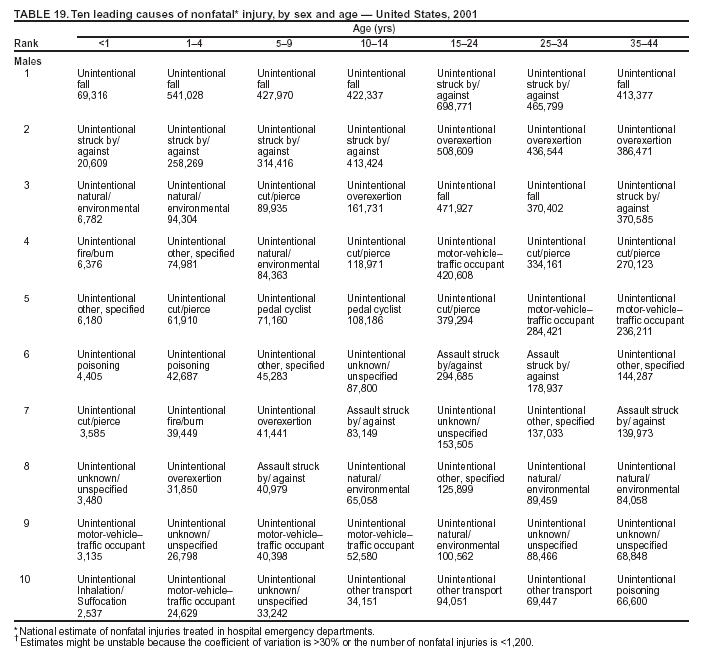 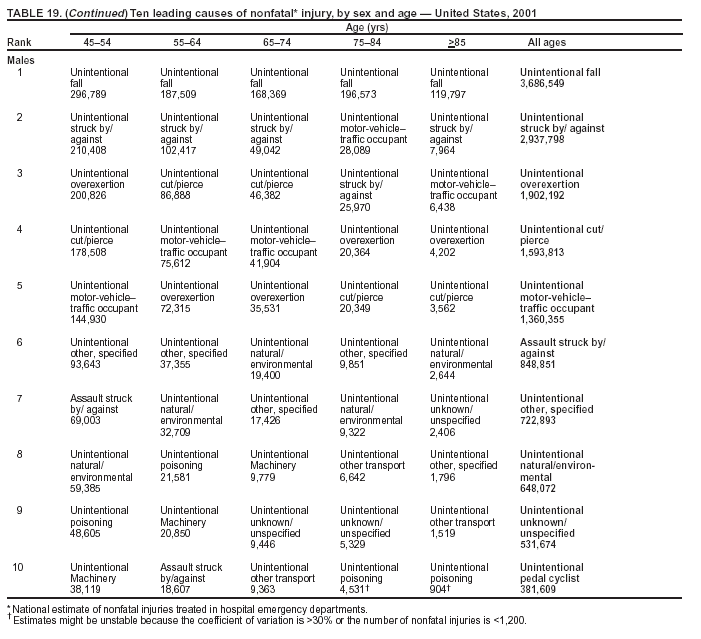 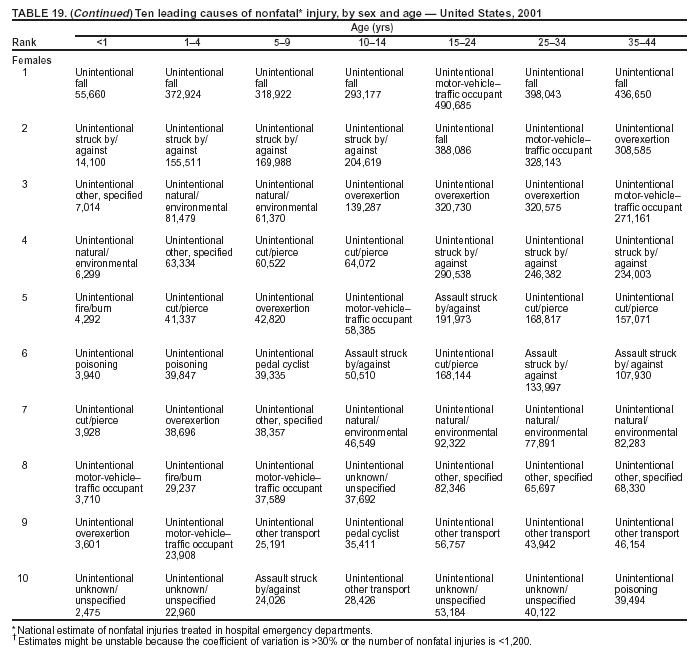 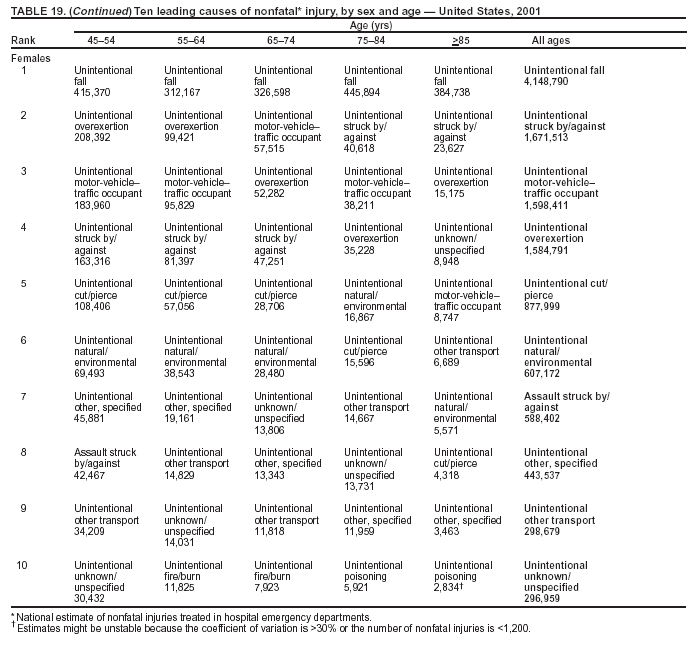 Return to top. Figure 19 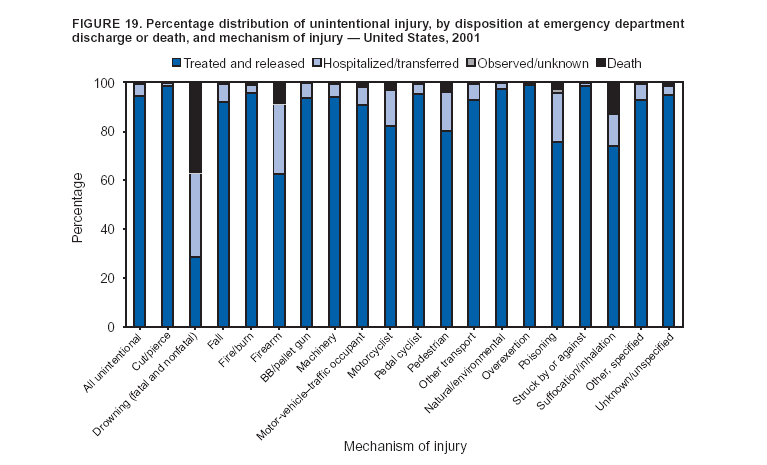 Return to top. Figure 20 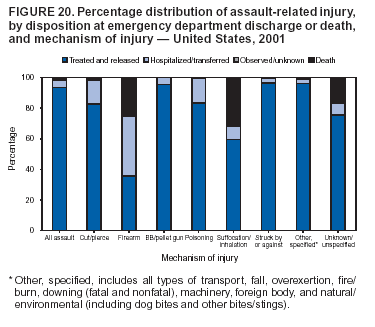 Return to top. Figure 21 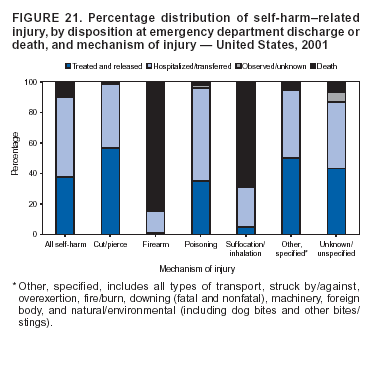 Return to top. Figure 22 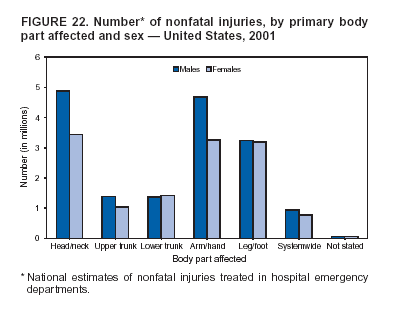 Return to top. Figure 23 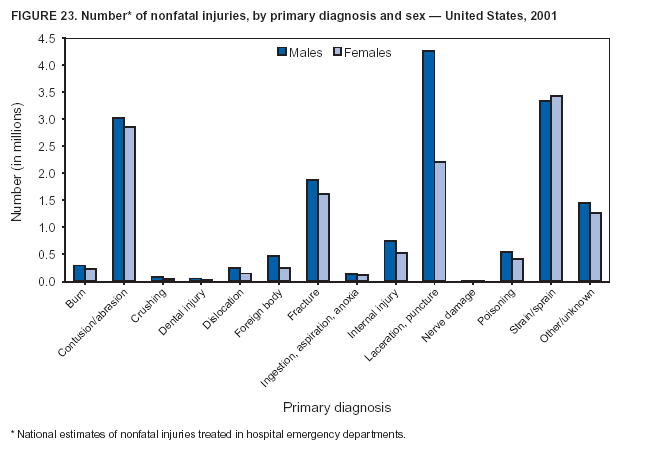 Return to top. Figure 24 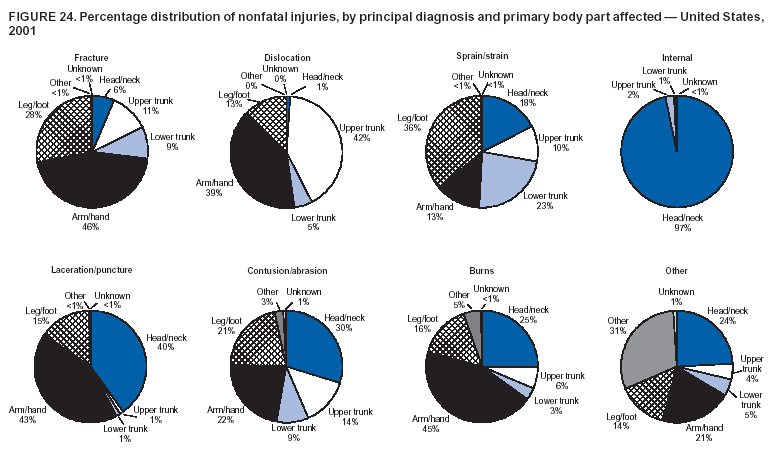 Return to top. Figure 25 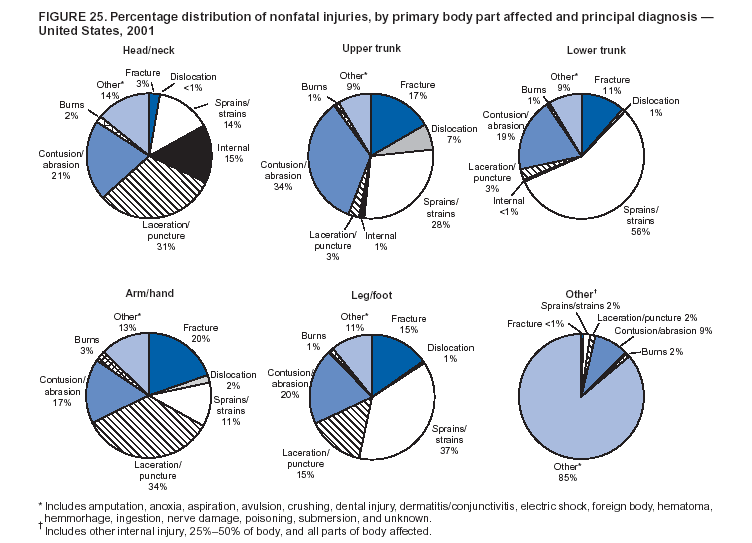 Return to top. Figure 26 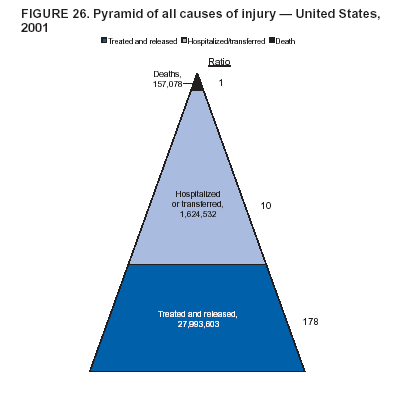 Return to top.
All MMWR HTML versions of articles are electronic conversions from ASCII text into HTML. This conversion may have resulted in character translation or format errors in the HTML version. Users should not rely on this HTML document, but are referred to the electronic PDF version and/or the original MMWR paper copy for the official text, figures, and tables. An original paper copy of this issue can be obtained from the Superintendent of Documents, U.S. Government Printing Office (GPO), Washington, DC 20402-9371; telephone: (202) 512-1800. Contact GPO for current prices. **Questions or messages regarding errors in formatting should be addressed to [email protected].Page converted: 8/23/2004 |
|||||||||
This page last reviewed 8/23/2004
|